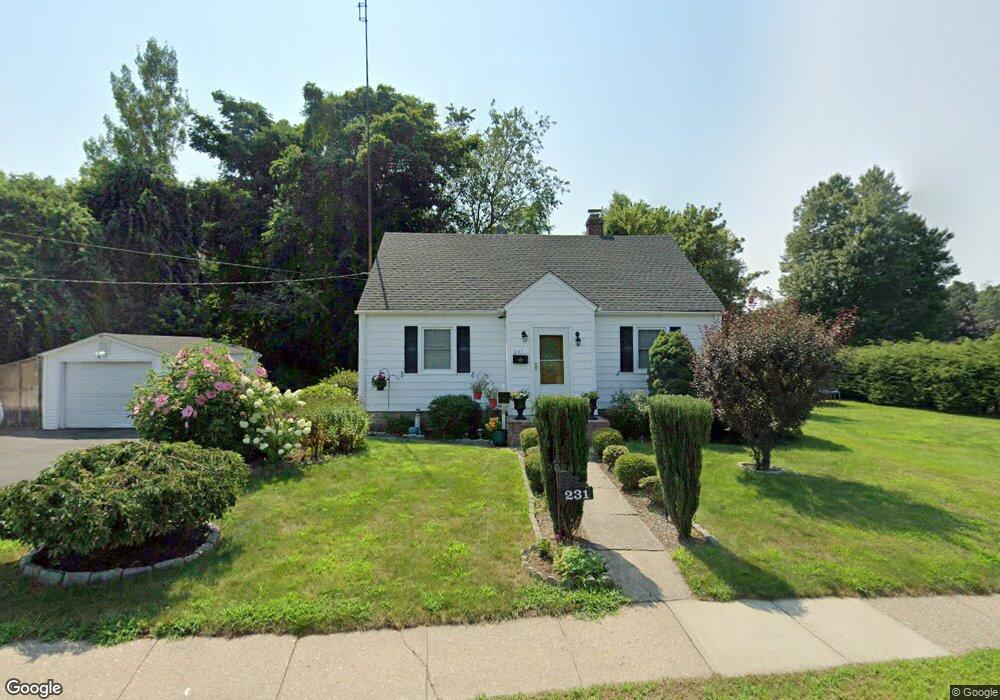
231 Connors Ln Stratford, CT 06614
Estimated Value: $439,000 - $526,000
3
Beds
2
Baths
1,505
Sq Ft
$318/Sq Ft
Est. Value
About This Home
This home is located at 231 Connors Ln, Stratford, CT 06614 and is currently estimated at $479,257, approximately $318 per square foot. 231 Connors Ln is a home located in Fairfield County with nearby schools including Eli Whitney Elementary School, Harry B. Flood Middle School, and Bunnell High School.
Ownership History
Date
Name
Owned For
Owner Type
Purchase Details
Closed on
Jul 7, 2023
Sold by
Martinez Salomon E
Bought by
Martinez Yolanda
Current Estimated Value
Purchase Details
Closed on
Aug 2, 2005
Sold by
Grettler Jeffrey and Grettler Ann
Bought by
Martinez Yolanda and Martinez Saloman
Home Financials for this Owner
Home Financials are based on the most recent Mortgage that was taken out on this home.
Original Mortgage
$225,750
Interest Rate
6.75%
Mortgage Type
Purchase Money Mortgage
Purchase Details
Closed on
Mar 18, 2002
Sold by
Xistris Evangelos D
Bought by
Grettler Jeffrey J and Grettler Ann R
Home Financials for this Owner
Home Financials are based on the most recent Mortgage that was taken out on this home.
Original Mortgage
$223,959
Interest Rate
7.04%
Mortgage Type
Purchase Money Mortgage
Create a Home Valuation Report for This Property
The Home Valuation Report is an in-depth analysis detailing your home's value as well as a comparison with similar homes in the area
Home Values in the Area
Average Home Value in this Area
Purchase History
| Date | Buyer | Sale Price | Title Company |
|---|---|---|---|
| Martinez Yolanda | -- | None Available | |
| Martinez Yolanda | $301,000 | -- | |
| Grettler Jeffrey J | $227,500 | -- |
Source: Public Records
Mortgage History
| Date | Status | Borrower | Loan Amount |
|---|---|---|---|
| Previous Owner | Grettler Jeffrey J | $225,750 | |
| Previous Owner | Grettler Jeffrey J | $228,600 | |
| Previous Owner | Grettler Jeffrey J | $223,959 |
Source: Public Records
Tax History Compared to Growth
Tax History
| Year | Tax Paid | Tax Assessment Tax Assessment Total Assessment is a certain percentage of the fair market value that is determined by local assessors to be the total taxable value of land and additions on the property. | Land | Improvement |
|---|---|---|---|---|
| 2025 | $7,105 | $176,750 | $99,260 | $77,490 |
| 2024 | $7,105 | $176,750 | $99,260 | $77,490 |
| 2023 | $7,105 | $176,750 | $99,260 | $77,490 |
| 2022 | $6,975 | $176,750 | $99,260 | $77,490 |
| 2021 | $6,976 | $176,750 | $99,260 | $77,490 |
| 2020 | $7,006 | $176,750 | $99,260 | $77,490 |
| 2019 | $6,514 | $163,380 | $83,510 | $79,870 |
| 2018 | $6,519 | $163,380 | $83,510 | $79,870 |
| 2017 | $6,530 | $163,380 | $83,510 | $79,870 |
| 2016 | $6,370 | $163,380 | $83,510 | $79,870 |
| 2015 | $6,042 | $163,380 | $83,510 | $79,870 |
| 2014 | $6,096 | $171,080 | $85,890 | $85,190 |
Source: Public Records
Map
Nearby Homes
- 165 Douglas St
- 1314 Huntington Rd
- 40 Delaware Dr
- 145 Dahl Ave
- 80 Sheffield Cir
- 120 Sheffield Cir
- 246 Delaware Dr
- 60 Carriage Dr
- 55 Leighton Dr
- 405 Highland Ave
- 100 Lambert Dr
- 771 Connors Ln
- 410 Seabreeze Dr
- 1618 Nichols Ave
- 155 Burbank Ave
- 248 Roger Dr
- 150 San Gabriel Ave
- 80 Wilbrook Rd
- 260 Goldbach Dr
- 10 Argonne Dr
- 255 Connors Ln
- 150 Douglas St
- 160 Douglas St
- 170 Douglas St
- 275 Connors Ln
- 140 Douglas St
- 276 Connors Ln
- 130 Douglas St
- 20 Bunnell Ave
- 155 Douglas St
- 210 Orchard Hill Dr
- 120 Douglas St
- 145 Douglas St
- 60 Bunnell Ave
- 315 Connors Ln
- 40 Bunnell Ave
- 135 Douglas St
- 215 Orchard Hill Dr
- 110 Douglas St
- 200 Orchard Hill Dr