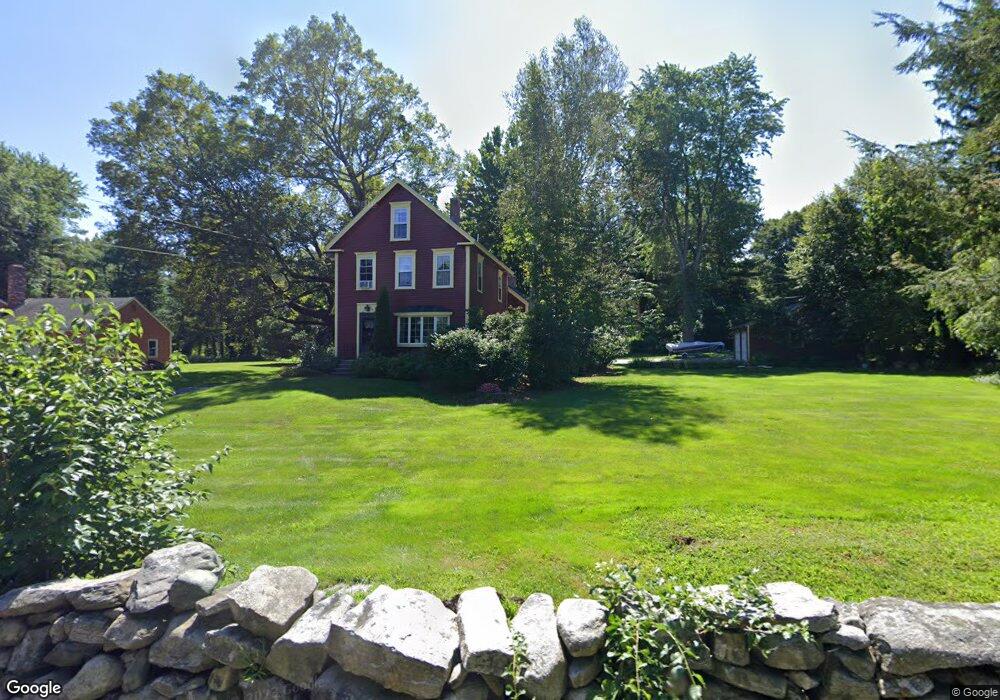
231 Crawford St Northborough, MA 01532
Estimated Value: $679,000 - $699,000
4
Beds
2
Baths
1,842
Sq Ft
$374/Sq Ft
Est. Value
About This Home
This home is located at 231 Crawford St, Northborough, MA 01532 and is currently estimated at $689,685, approximately $374 per square foot. 231 Crawford St is a home located in Worcester County with nearby schools including Lincoln Street Elementary School, Robert E. Melican Middle School, and Algonquin Regional High School.
Ownership History
Date
Name
Owned For
Owner Type
Purchase Details
Closed on
Dec 21, 2022
Sold by
Meoli Stephen J and Meoli Pamela P
Bought by
Pamela P Meoli T
Current Estimated Value
Purchase Details
Closed on
Sep 26, 1997
Sold by
Oates Stephen F and Oates Luann M
Bought by
Meoli Stephen J and Meoli Pamela P
Purchase Details
Closed on
Jan 30, 1996
Sold by
Maney Paul S and Maney Amy
Bought by
Oates Stephen F and Oates Luann
Purchase Details
Closed on
Sep 28, 1994
Sold by
Wright Joseph B and Wright Hilary
Bought by
Maney Paul S and Maney Amy
Create a Home Valuation Report for This Property
The Home Valuation Report is an in-depth analysis detailing your home's value as well as a comparison with similar homes in the area
Home Values in the Area
Average Home Value in this Area
Purchase History
| Date | Buyer | Sale Price | Title Company |
|---|---|---|---|
| Pamela P Meoli T | -- | None Available | |
| Meoli Stephen J | $230,000 | -- | |
| Oates Stephen F | $208,000 | -- | |
| Maney Paul S | $220,000 | -- |
Source: Public Records
Mortgage History
| Date | Status | Borrower | Loan Amount |
|---|---|---|---|
| Previous Owner | Maney Paul S | $246,000 | |
| Previous Owner | Maney Paul S | $30,000 |
Source: Public Records
Tax History Compared to Growth
Tax History
| Year | Tax Paid | Tax Assessment Tax Assessment Total Assessment is a certain percentage of the fair market value that is determined by local assessors to be the total taxable value of land and additions on the property. | Land | Improvement |
|---|---|---|---|---|
| 2025 | $8,416 | $590,600 | $318,600 | $272,000 |
| 2024 | $7,177 | $502,600 | $253,900 | $248,700 |
| 2023 | $7,175 | $485,100 | $239,500 | $245,600 |
| 2022 | $7,078 | $429,200 | $228,300 | $200,900 |
| 2021 | $6,762 | $395,000 | $207,900 | $187,100 |
| 2020 | $6,569 | $380,800 | $196,300 | $184,500 |
| 2019 | $6,411 | $373,800 | $190,700 | $183,100 |
| 2018 | $6,198 | $356,400 | $185,500 | $170,900 |
| 2017 | $5,991 | $344,500 | $185,500 | $159,000 |
| 2016 | $5,853 | $340,900 | $181,900 | $159,000 |
| 2015 | $5,879 | $351,400 | $192,900 | $158,500 |
| 2014 | $5,684 | $342,600 | $192,900 | $149,700 |
Source: Public Records
Map
Nearby Homes