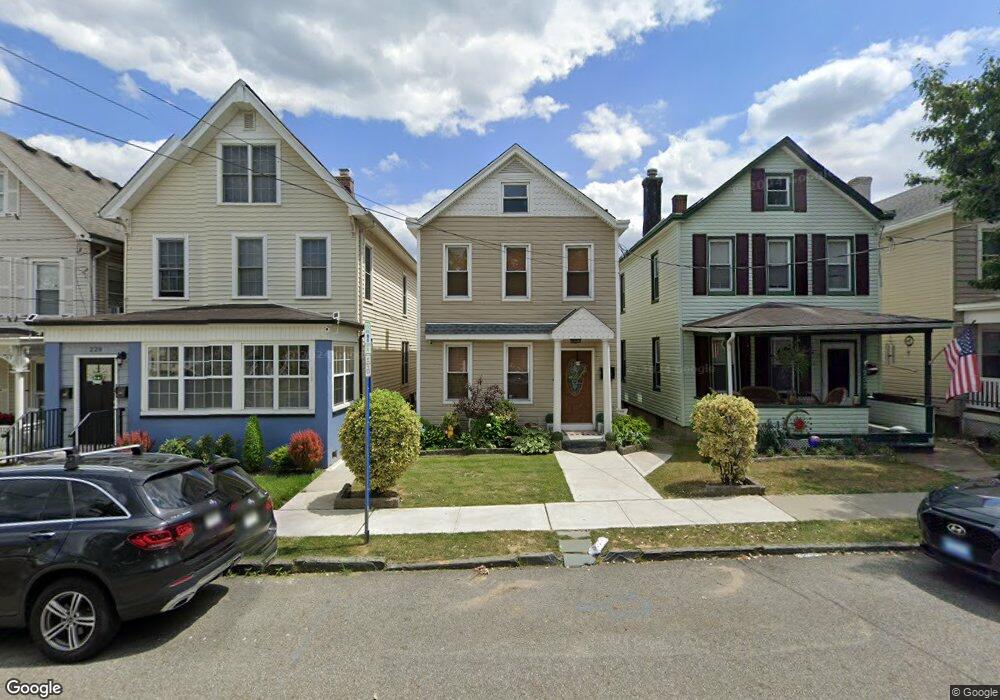
231 David St South Amboy, NJ 08879
Estimated Value: $419,000 - $495,000
4
Beds
2
Baths
1,484
Sq Ft
$305/Sq Ft
Est. Value
About This Home
This home is located at 231 David St, South Amboy, NJ 08879 and is currently estimated at $452,194, approximately $304 per square foot. 231 David St is a home located in Middlesex County with nearby schools including South Amboy Elementary School, South Amboy Middle/High School, and St. Mary Elementary School.
Ownership History
Date
Name
Owned For
Owner Type
Purchase Details
Closed on
Jun 28, 2006
Sold by
Kraft Daniel
Bought by
Mercado Jimmy and Mercado Anna
Current Estimated Value
Home Financials for this Owner
Home Financials are based on the most recent Mortgage that was taken out on this home.
Original Mortgage
$306,450
Outstanding Balance
$182,133
Interest Rate
6.67%
Mortgage Type
VA
Estimated Equity
$270,061
Purchase Details
Closed on
Jan 12, 2003
Sold by
Hamdan Joseph
Bought by
Kraft Daniel
Home Financials for this Owner
Home Financials are based on the most recent Mortgage that was taken out on this home.
Original Mortgage
$180,000
Interest Rate
5.98%
Purchase Details
Closed on
Sep 30, 1993
Sold by
Estate Of Mary Lenahan
Bought by
Owens John and Owens Denise
Home Financials for this Owner
Home Financials are based on the most recent Mortgage that was taken out on this home.
Original Mortgage
$95,000
Interest Rate
7%
Create a Home Valuation Report for This Property
The Home Valuation Report is an in-depth analysis detailing your home's value as well as a comparison with similar homes in the area
Home Values in the Area
Average Home Value in this Area
Purchase History
| Date | Buyer | Sale Price | Title Company |
|---|---|---|---|
| Mercado Jimmy | $300,000 | -- | |
| Kraft Daniel | $149,900 | -- | |
| Owens John | $99,500 | -- |
Source: Public Records
Mortgage History
| Date | Status | Borrower | Loan Amount |
|---|---|---|---|
| Open | Mercado Jimmy | $306,450 | |
| Previous Owner | Kraft Daniel | $180,000 | |
| Previous Owner | Owens John | $95,000 |
Source: Public Records
Tax History Compared to Growth
Tax History
| Year | Tax Paid | Tax Assessment Tax Assessment Total Assessment is a certain percentage of the fair market value that is determined by local assessors to be the total taxable value of land and additions on the property. | Land | Improvement |
|---|---|---|---|---|
| 2025 | $5,898 | $183,800 | $112,500 | $71,300 |
| 2024 | $5,676 | $183,800 | $112,500 | $71,300 |
| 2023 | $5,676 | $183,800 | $112,500 | $71,300 |
| 2022 | $5,393 | $183,800 | $112,500 | $71,300 |
| 2021 | $5,303 | $183,800 | $112,500 | $71,300 |
| 2020 | $5,178 | $183,800 | $112,500 | $71,300 |
| 2019 | $5,095 | $183,800 | $112,500 | $71,300 |
| 2018 | $5,053 | $183,800 | $112,500 | $71,300 |
| 2017 | $4,972 | $183,800 | $112,500 | $71,300 |
| 2016 | $4,847 | $183,800 | $112,500 | $71,300 |
| 2015 | $4,882 | $183,800 | $112,500 | $71,300 |
| 2014 | $4,714 | $183,800 | $112,500 | $71,300 |
Source: Public Records
Map
Nearby Homes
- 223 Henry St
- 112 N Broadway Unit C
- 112 N Broadway Unit G
- 101 N Stevens Ave
- 123 S Stevens Ave
- 251 Church St
- 237 George St
- 209 1st St
- 245 2nd St
- 322 George St
- 109 Adamecs Way
- 114 Adamecs Way Unit C114
- 125 Adamecs Way Unit 26
- 111 John St
- 189 N Broadway
- 165 2nd St
- 224 Gordon St
- 149 Main St Unit 33
- 231 N Stevens Ave
- 411 Lefferts St