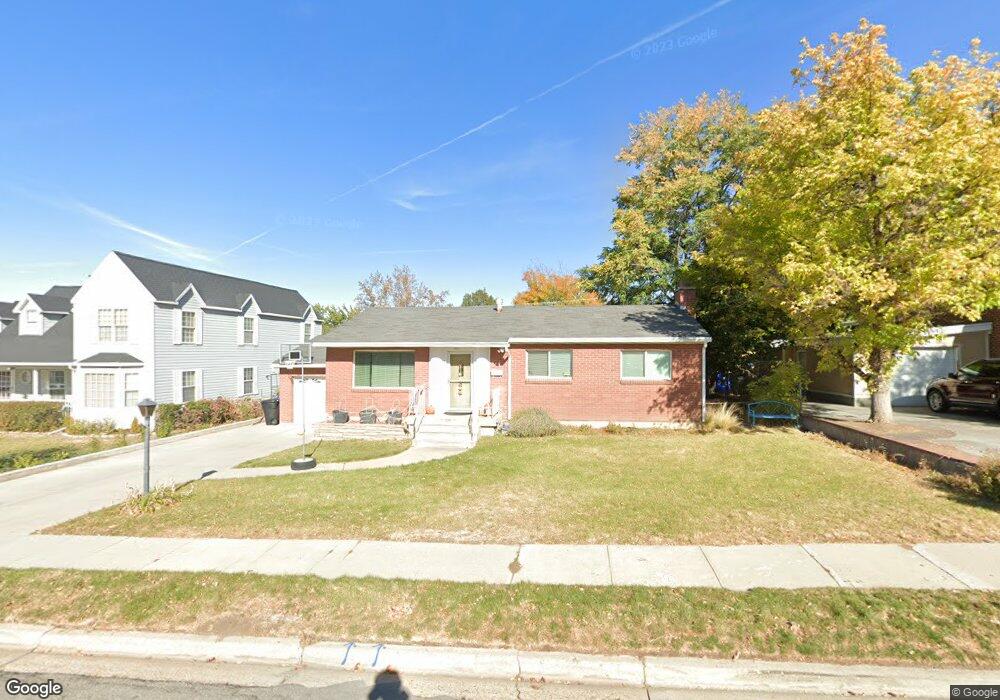
231 E 1100 S Bountiful, UT 84010
Estimated Value: $483,000 - $535,716
5
Beds
2
Baths
2,184
Sq Ft
$234/Sq Ft
Est. Value
About This Home
This home is located at 231 E 1100 S, Bountiful, UT 84010 and is currently estimated at $511,179, approximately $234 per square foot. 231 E 1100 S is a home located in Davis County with nearby schools including Bountiful Elementary School, Millcreek Junior High School, and Bountiful High School.
Ownership History
Date
Name
Owned For
Owner Type
Purchase Details
Closed on
Oct 2, 2006
Sold by
Benson Douglas E and Benson Lindsay D
Bought by
Shumway Roger G and Shumway Carrie T
Current Estimated Value
Home Financials for this Owner
Home Financials are based on the most recent Mortgage that was taken out on this home.
Original Mortgage
$36,750
Outstanding Balance
$21,792
Interest Rate
6.44%
Mortgage Type
Stand Alone Second
Estimated Equity
$489,387
Purchase Details
Closed on
Apr 26, 2004
Sold by
Jones Ellen Mae D
Bought by
Benson Douglas E and Benson Lindsay D
Home Financials for this Owner
Home Financials are based on the most recent Mortgage that was taken out on this home.
Original Mortgage
$143,252
Interest Rate
5.39%
Mortgage Type
FHA
Create a Home Valuation Report for This Property
The Home Valuation Report is an in-depth analysis detailing your home's value as well as a comparison with similar homes in the area
Purchase History
| Date | Buyer | Sale Price | Title Company |
|---|---|---|---|
| Shumway Roger G | -- | Bonneville Superior Title Co | |
| Benson Douglas E | -- | Bonneville Title Company Inc |
Source: Public Records
Mortgage History
| Date | Status | Borrower | Loan Amount |
|---|---|---|---|
| Open | Shumway Roger G | $36,750 | |
| Open | Shumway Roger G | $196,000 | |
| Previous Owner | Benson Douglas E | $143,252 | |
| Closed | Benson Douglas E | $6,800 |
Source: Public Records
Tax History
| Year | Tax Paid | Tax Assessment Tax Assessment Total Assessment is a certain percentage of the fair market value that is determined by local assessors to be the total taxable value of land and additions on the property. | Land | Improvement |
|---|---|---|---|---|
| 2025 | $2,844 | $255,750 | $135,003 | $120,747 |
| 2024 | $2,650 | $247,500 | $121,441 | $126,059 |
| 2023 | $2,543 | $431,000 | $222,703 | $208,297 |
| 2022 | $2,690 | $250,800 | $121,414 | $129,386 |
| 2021 | $2,302 | $327,000 | $160,449 | $166,551 |
| 2020 | $2,039 | $290,000 | $136,556 | $153,444 |
| 2019 | $2,051 | $285,000 | $140,843 | $144,157 |
| 2018 | $1,912 | $261,000 | $137,984 | $123,016 |
| 2016 | $1,631 | $120,395 | $58,239 | $62,156 |
| 2015 | $1,602 | $111,595 | $58,239 | $53,356 |
| 2014 | $1,642 | $118,300 | $58,239 | $60,061 |
| 2013 | -- | $104,772 | $43,945 | $60,827 |
Source: Public Records
Map
Nearby Homes
- 545 S 100 E
- 337 Peach Ln
- 275 E Peach Ln S
- 109 W 900 S
- 1654 S 100 E
- 520 S Orchard Dr Unit 17
- 650 S Main St Unit 9106
- 650 S Main St Unit 6111
- 34 W 400 S
- 1350 S 200 W
- 32 W 400 S
- 438 E 1800 S
- 1314 S 200 W Unit 19
- 1820 S 50 W
- 53 W 1800 S
- 631 E 1700 S
- 795 Abby Ln Unit 5
- 861 E Millbrook Way
- 103 S 100 E
- 1886 S Jeri Dr