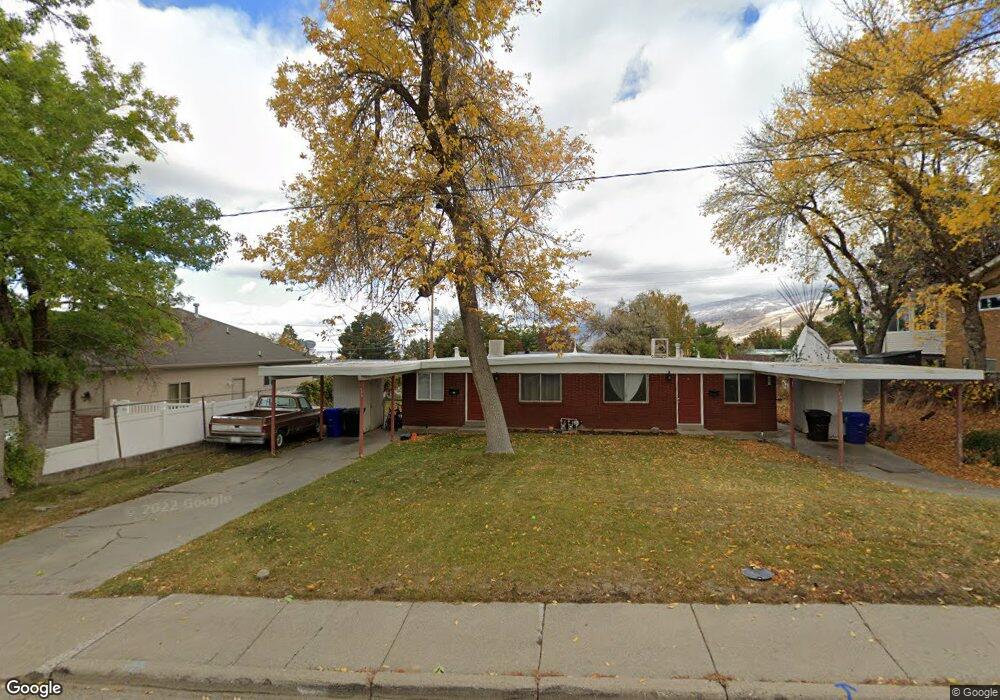
231 E 2200 S Bountiful, UT 84010
Estimated Value: $479,000 - $547,000
4
Beds
2
Baths
1,800
Sq Ft
$289/Sq Ft
Est. Value
About This Home
This home is located at 231 E 2200 S, Bountiful, UT 84010 and is currently estimated at $519,302, approximately $288 per square foot. 231 E 2200 S is a home located in Davis County with nearby schools including Muir School, Mueller Park Junior High School, and Bountiful High School.
Ownership History
Date
Name
Owned For
Owner Type
Purchase Details
Closed on
Jan 7, 2021
Sold by
Nguyen Van
Bought by
V & I Llc
Current Estimated Value
Home Financials for this Owner
Home Financials are based on the most recent Mortgage that was taken out on this home.
Original Mortgage
$277,000
Outstanding Balance
$201,073
Interest Rate
2.7%
Mortgage Type
New Conventional
Estimated Equity
$318,229
Purchase Details
Closed on
Jul 1, 2020
Sold by
Nguyen Van and Lin Iching
Bought by
V & I Llc
Home Financials for this Owner
Home Financials are based on the most recent Mortgage that was taken out on this home.
Original Mortgage
$276,000
Interest Rate
3.1%
Mortgage Type
New Conventional
Purchase Details
Closed on
Jun 25, 2020
Sold by
Taylor Ryan J
Bought by
Nguyen Van and Lin Iching
Home Financials for this Owner
Home Financials are based on the most recent Mortgage that was taken out on this home.
Original Mortgage
$276,000
Interest Rate
3.1%
Mortgage Type
New Conventional
Create a Home Valuation Report for This Property
The Home Valuation Report is an in-depth analysis detailing your home's value as well as a comparison with similar homes in the area
Purchase History
| Date | Buyer | Sale Price | Title Company |
|---|---|---|---|
| V & I Llc | -- | Us Title Company Of | |
| Nguyen Van | -- | Us Title Company Of | |
| V & I Llc | -- | Premium Title & Escrow Inc | |
| Nguyen Van | -- | Platinum Title & Esc |
Source: Public Records
Mortgage History
| Date | Status | Borrower | Loan Amount |
|---|---|---|---|
| Open | Nguyen Van | $277,000 | |
| Previous Owner | Nguyen Van | $276,000 |
Source: Public Records
Tax History
| Year | Tax Paid | Tax Assessment Tax Assessment Total Assessment is a certain percentage of the fair market value that is determined by local assessors to be the total taxable value of land and additions on the property. | Land | Improvement |
|---|---|---|---|---|
| 2025 | $3,658 | $265,100 | $140,770 | $124,330 |
| 2024 | $3,290 | $259,049 | $128,401 | $130,648 |
| 2023 | $2,907 | $246,400 | $128,596 | $117,803 |
| 2022 | $3,021 | $467,000 | $230,959 | $236,041 |
| 2021 | $2,533 | $360,000 | $166,347 | $193,653 |
| 2020 | $2,067 | $292,000 | $141,105 | $150,895 |
| 2019 | $2,092 | $289,000 | $142,442 | $146,558 |
| 2018 | $1,927 | $261,000 | $139,480 | $121,520 |
| 2016 | $1,449 | $104,665 | $57,073 | $47,592 |
| 2015 | $1,416 | $96,415 | $57,073 | $39,342 |
| 2014 | $1,354 | $94,901 | $57,073 | $37,828 |
| 2013 | -- | $103,948 | $43,945 | $60,003 |
Source: Public Records
Map
Nearby Homes
- 320 E 2100 S
- 296 E 2050 S Unit 2
- 188 E 2050 S Unit D3
- 2046 S 350 E Unit 4
- 2038 S 350 E Unit 3
- 295 E 2050 S Unit 1
- 2059 S 350 E Unit 6
- 2064 S Orchard Dr
- 41 E 2200 S
- 2183 Penman Ln
- 2 E Wicker Ln
- 69 E North Canyon Rd
- 19 E North Canyon Rd
- 1886 S Jeri Dr
- 288 E 1650 S
- 1820 S 50 W
- 141 E 1650 S
- 631 E 1700 S
- 380 E 1500 S
- 1940 S 200 W Unit 3
- 225 E 2200 S
- 243 E 2200 S
- 216 E 2100 S
- 234 E 2100 S
- 217 E 2200 S
- 208 E 2100 S
- 2213 S 200 E
- 251 E 2200 S
- 252 E 2100 S
- 246 E 2200 S
- 209 E 2200 S
- 2092 S 200 E
- 2233 S 200 E
- 269 E 2200 S
- 2147 Orchard Pines Loop
- 2139 Orchard Pines Loop
- 270 E 2100 S
- 2133 Orchard Pines Loop
- 198 E 2200 S
- 2119 Orchard Pines Loop
Your Personal Tour Guide
Ask me questions while you tour the home.