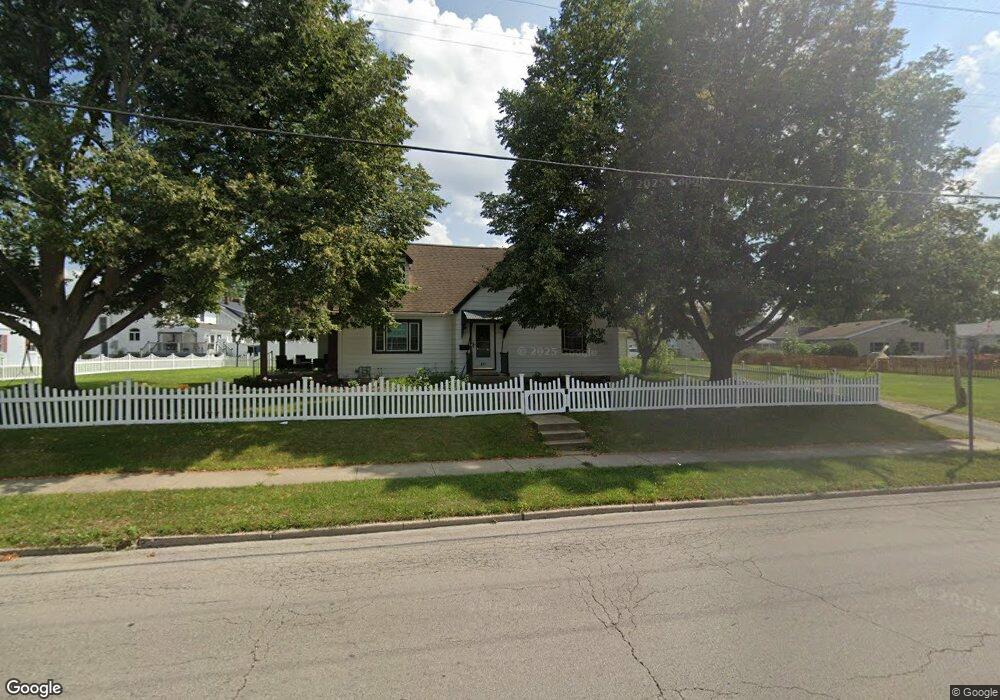
231 E Broadway St Covington, OH 45318
Estimated Value: $253,000 - $283,000
4
Beds
3
Baths
1,883
Sq Ft
$142/Sq Ft
Est. Value
About This Home
This home is located at 231 E Broadway St, Covington, OH 45318 and is currently estimated at $268,145, approximately $142 per square foot. 231 E Broadway St is a home located in Miami County with nearby schools including Covington Elementary/Junior High School, Covington Junior High School, and Covington High School.
Ownership History
Date
Name
Owned For
Owner Type
Purchase Details
Closed on
Jan 20, 2026
Sold by
Cruse Gregory and Cruse Briana
Bought by
White Kaela and White Deron
Current Estimated Value
Home Financials for this Owner
Home Financials are based on the most recent Mortgage that was taken out on this home.
Original Mortgage
$256,500
Outstanding Balance
$256,500
Interest Rate
6.22%
Mortgage Type
New Conventional
Estimated Equity
$11,645
Purchase Details
Closed on
Apr 29, 2022
Sold by
Ulsh and Debra
Bought by
Cruse Gregory and Cruse Briana
Home Financials for this Owner
Home Financials are based on the most recent Mortgage that was taken out on this home.
Original Mortgage
$80,000
Interest Rate
4.16%
Mortgage Type
New Conventional
Purchase Details
Closed on
Jun 2, 2020
Sold by
Seger Bradley T and Seger Amy R
Bought by
Ulsh Michael and Ulsh Debra
Purchase Details
Closed on
Feb 10, 2016
Sold by
Bell Annette K
Bought by
Seger Bradley T and Seger Amy R
Home Financials for this Owner
Home Financials are based on the most recent Mortgage that was taken out on this home.
Original Mortgage
$126,060
Interest Rate
3.97%
Mortgage Type
New Conventional
Purchase Details
Closed on
Apr 19, 2010
Sold by
Gearhardt Larry Robert
Bought by
Forror Robert K and Forror Patty L
Purchase Details
Closed on
Apr 7, 2010
Sold by
Gearhardt Nancy J
Bought by
Robert S Gearhardt Revocable Living Trus
Purchase Details
Closed on
Oct 21, 2009
Sold by
Gearhardt Nancy J
Bought by
Gearhardt Robert S and Nancy J Gearhardt Trust
Purchase Details
Closed on
Jan 1, 1990
Bought by
Gearhardt Robert S
Create a Home Valuation Report for This Property
The Home Valuation Report is an in-depth analysis detailing your home's value as well as a comparison with similar homes in the area
Home Values in the Area
Average Home Value in this Area
Purchase History
| Date | Buyer | Sale Price | Title Company |
|---|---|---|---|
| White Kaela | $270,000 | None Listed On Document | |
| Cruse Gregory | $215,000 | Mantica Christopher J | |
| Ulsh Michael | $150,000 | Chicago Title Company Llc | |
| Seger Bradley T | $132,000 | Attorney | |
| Forror Robert K | $62,500 | -- | |
| Robert S Gearhardt Revocable Living Trus | -- | -- | |
| Gearhardt Robert S | -- | -- | |
| Gearhardt Robert S | -- | -- |
Source: Public Records
Mortgage History
| Date | Status | Borrower | Loan Amount |
|---|---|---|---|
| Open | White Kaela | $256,500 | |
| Previous Owner | Cruse Gregory | $80,000 | |
| Previous Owner | Seger Bradley T | $126,060 |
Source: Public Records
Tax History
| Year | Tax Paid | Tax Assessment Tax Assessment Total Assessment is a certain percentage of the fair market value that is determined by local assessors to be the total taxable value of land and additions on the property. | Land | Improvement |
|---|---|---|---|---|
| 2025 | $2,424 | $74,270 | $8,820 | $65,450 |
| 2024 | $2,424 | $56,990 | $9,560 | $47,430 |
| 2023 | $2,134 | $56,990 | $9,560 | $47,430 |
| 2022 | $2,129 | $56,990 | $9,560 | $47,430 |
| 2021 | $1,767 | $43,820 | $7,350 | $36,470 |
| 2020 | $1,771 | $43,820 | $7,350 | $36,470 |
| 2019 | $1,779 | $43,820 | $7,350 | $36,470 |
| 2018 | $1,632 | $39,210 | $5,640 | $33,570 |
| 2017 | $1,661 | $39,210 | $5,640 | $33,570 |
| 2016 | $1,641 | $39,210 | $5,640 | $33,570 |
| 2015 | $1,144 | $37,700 | $5,430 | $32,270 |
| 2014 | $1,144 | $37,700 | $5,430 | $32,270 |
| 2013 | $1,102 | $37,700 | $5,430 | $32,270 |
Source: Public Records
Map
Nearby Homes
- 307 N Grant St
- 243 E Broadway St
- 303 N Grant St
- 221 E Broadway St
- 224 E Broadway St
- 301 Chestnut St
- 312 N Grant St
- 258 E Broadway St
- 258 E Broadway St Unit X
- 303 E Broadway St
- 215 E Broadway St
- 222 E Broadway St
- 222 E Broadway St Unit Covington
- 213 N Grant St
- 308 N Grant St
- 250 College St
- 311 E Broadway St
- 301 College St
- 304 N Grant St
- 220 E Broadway St
Your Personal Tour Guide
Ask me questions while you tour the home.