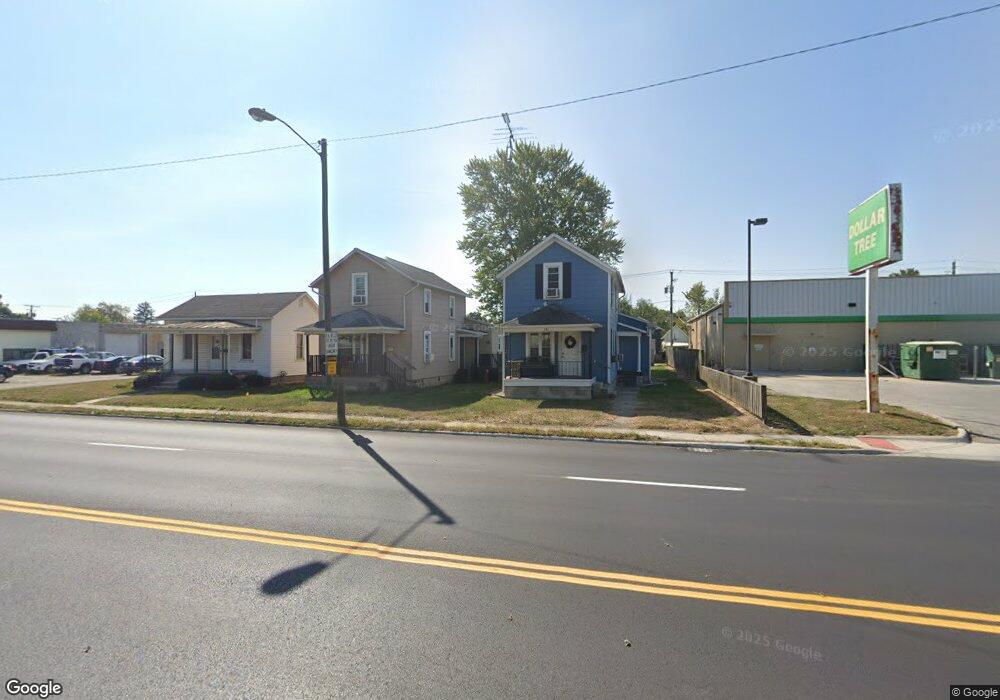
231 E Lytle St Fostoria, OH 44830
Estimated Value: $44,000 - $106,000
3
Beds
1
Bath
1,364
Sq Ft
$53/Sq Ft
Est. Value
About This Home
This home is located at 231 E Lytle St, Fostoria, OH 44830 and is currently estimated at $72,305, approximately $53 per square foot. 231 E Lytle St is a home located in Seneca County with nearby schools including Fostoria Intermediate Elementary School and Fostoria Junior/Senior High School.
Ownership History
Date
Name
Owned For
Owner Type
Purchase Details
Closed on
Jan 27, 2011
Sold by
Schalk Stepheb G
Bought by
Schalk Rentals Llc
Current Estimated Value
Purchase Details
Closed on
Mar 31, 2008
Sold by
Hsbc Mortgage Inc
Bought by
Schalk Stephen G
Purchase Details
Closed on
Nov 6, 2003
Sold by
Cole Daisy E
Bought by
Thomas Stanley A
Create a Home Valuation Report for This Property
The Home Valuation Report is an in-depth analysis detailing your home's value as well as a comparison with similar homes in the area
Home Values in the Area
Average Home Value in this Area
Purchase History
We collect this data history from publicly available records. To have your information removed, we recommend requesting removal directly through your county’s website.
| Date | Buyer | Sale Price | Title Company |
|---|---|---|---|
| Schalk Rentals Llc | -- | None Available | |
| Schalk Stephen G | $18,800 | None Available | |
| Thomas Stanley A | $38,500 | -- |
Source: Public Records
Tax History
| Year | Tax Paid | Tax Assessment Tax Assessment Total Assessment is a certain percentage of the fair market value that is determined by local assessors to be the total taxable value of land and additions on the property. | Land | Improvement |
|---|---|---|---|---|
| 2025 | $610 | $12,140 | $1,450 | $10,690 |
| 2024 | $629 | $12,140 | $1,450 | $10,690 |
| 2023 | $630 | $12,140 | $1,450 | $10,690 |
| 2022 | $528 | $9,050 | $1,570 | $7,480 |
| 2021 | $539 | $9,050 | $1,570 | $7,480 |
| 2020 | $542 | $9,048 | $1,568 | $7,480 |
| 2019 | $505 | $8,365 | $1,449 | $6,916 |
| 2018 | $515 | $8,365 | $1,449 | $6,916 |
| 2017 | $497 | $8,365 | $1,449 | $6,916 |
| 2016 | $488 | $8,901 | $1,600 | $7,301 |
| 2015 | $480 | $8,901 | $1,600 | $7,301 |
| 2014 | $458 | $8,901 | $1,600 | $7,301 |
| 2013 | $536 | $9,671 | $1,740 | $7,931 |
Source: Public Records
Map
Nearby Homes
- 260 E 6th St
- 919 S Main St
- 1100 S Main St
- 128 W Clark St
- 242 Sycamore St
- 301 E Tiffin St
- 0 W South Route 12
- 630 Columbus Ave
- 337 Mcdougal St
- 325 Mcdougal St
- 306 E High St
- 516 Maple St
- 429 N Union St
- 517 W North St
- 37 Barcelona Dr
- 520 N Union St
- 0 Bugner St Unit 6131864
- 565 W Fremont St
- 156 Elm St
- 77 Barcelona Dr
Your Personal Tour Guide
Ask me questions while you tour the home.