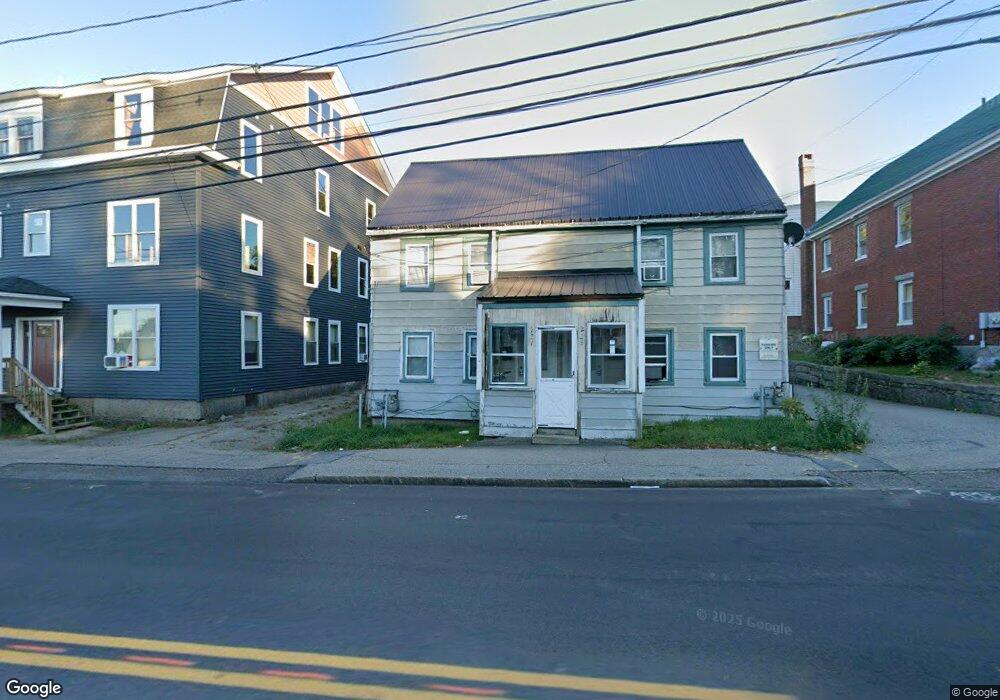
231 Elm St Unit 233 Biddeford, ME 04005
Downtown Biddeford NeighborhoodEstimated Value: $403,033 - $508,000
5
Beds
2
Baths
1,848
Sq Ft
$246/Sq Ft
Est. Value
About This Home
This home is located at 231 Elm St Unit 233, Biddeford, ME 04005 and is currently estimated at $454,008, approximately $245 per square foot. 231 Elm St Unit 233 is a home located in York County with nearby schools including John F Kennedy Memorial School, Biddeford Primary School, and Biddeford Intermediate School.
Ownership History
Date
Name
Owned For
Owner Type
Purchase Details
Closed on
Mar 19, 2021
Sold by
Pare Mark
Bought by
Mpre Holdings Llc
Current Estimated Value
Home Financials for this Owner
Home Financials are based on the most recent Mortgage that was taken out on this home.
Original Mortgage
$217,500
Outstanding Balance
$194,973
Interest Rate
2.7%
Mortgage Type
Purchase Money Mortgage
Estimated Equity
$259,035
Create a Home Valuation Report for This Property
The Home Valuation Report is an in-depth analysis detailing your home's value as well as a comparison with similar homes in the area
Home Values in the Area
Average Home Value in this Area
Purchase History
| Date | Buyer | Sale Price | Title Company |
|---|---|---|---|
| Mpre Holdings Llc | -- | None Available |
Source: Public Records
Mortgage History
| Date | Status | Borrower | Loan Amount |
|---|---|---|---|
| Open | Mpre Holdings Llc | $217,500 |
Source: Public Records
Tax History Compared to Growth
Tax History
| Year | Tax Paid | Tax Assessment Tax Assessment Total Assessment is a certain percentage of the fair market value that is determined by local assessors to be the total taxable value of land and additions on the property. | Land | Improvement |
|---|---|---|---|---|
| 2024 | $3,892 | $273,700 | $126,900 | $146,800 |
| 2023 | $3,561 | $271,400 | $126,900 | $144,500 |
| 2022 | $2,780 | $169,400 | $60,800 | $108,600 |
| 2021 | $2,621 | $143,800 | $49,700 | $94,100 |
| 2020 | $2,370 | $118,200 | $38,700 | $79,500 |
| 2019 | $2,362 | $118,200 | $38,700 | $79,500 |
| 2018 | $2,329 | $118,200 | $38,700 | $79,500 |
| 2017 | $2,304 | $114,800 | $38,700 | $76,100 |
| 2016 | $2,280 | $114,800 | $38,700 | $76,100 |
| 2015 | $2,235 | $114,800 | $38,700 | $76,100 |
| 2014 | -- | $114,800 | $38,700 | $76,100 |
| 2013 | -- | $147,500 | $69,300 | $78,200 |
Source: Public Records
Map
Nearby Homes