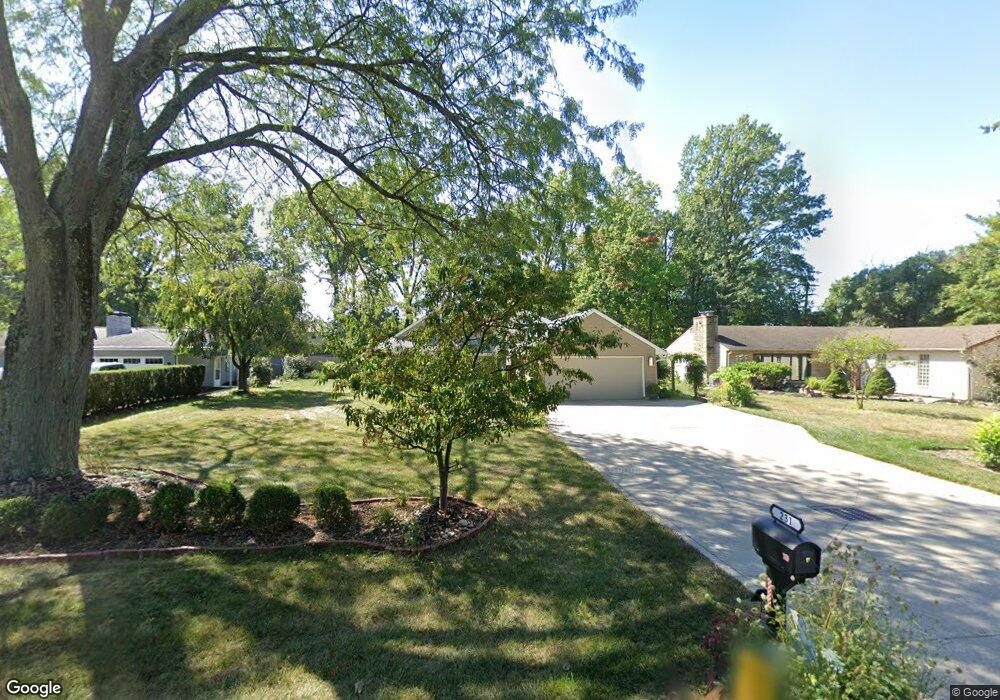
231 Fairway Blvd Columbus, OH 43213
The Fairway NeighborhoodEstimated Value: $323,331 - $395,000
3
Beds
3
Baths
2,400
Sq Ft
$149/Sq Ft
Est. Value
About This Home
This home is located at 231 Fairway Blvd, Columbus, OH 43213 and is currently estimated at $357,583, approximately $148 per square foot. 231 Fairway Blvd is a home located in Franklin County with nearby schools including Etna Road Elementary School, Beechwood Elementary School, and Rosemore Middle School.
Ownership History
Date
Name
Owned For
Owner Type
Purchase Details
Closed on
Oct 7, 2002
Sold by
Reichley Judith M
Bought by
Clites Carmen S and Clites Linda M
Current Estimated Value
Home Financials for this Owner
Home Financials are based on the most recent Mortgage that was taken out on this home.
Original Mortgage
$136,800
Interest Rate
6.24%
Mortgage Type
Purchase Money Mortgage
Purchase Details
Closed on
Dec 18, 2000
Sold by
Myers John R
Bought by
Reichley Judith M
Purchase Details
Closed on
Aug 3, 1999
Sold by
Neal June C and West June C
Bought by
Reichley Judith M and Myers John R
Home Financials for this Owner
Home Financials are based on the most recent Mortgage that was taken out on this home.
Original Mortgage
$127,200
Interest Rate
7.68%
Purchase Details
Closed on
Sep 5, 1974
Bought by
Neal June C
Create a Home Valuation Report for This Property
The Home Valuation Report is an in-depth analysis detailing your home's value as well as a comparison with similar homes in the area
Home Values in the Area
Average Home Value in this Area
Purchase History
| Date | Buyer | Sale Price | Title Company |
|---|---|---|---|
| Clites Carmen S | $171,000 | -- | |
| Reichley Judith M | -- | -- | |
| Reichley Judith M | $159,000 | George Pritsolas Title | |
| Neal June C | -- | -- |
Source: Public Records
Mortgage History
| Date | Status | Borrower | Loan Amount |
|---|---|---|---|
| Previous Owner | Clites Carmen S | $136,800 | |
| Previous Owner | Reichley Judith M | $127,200 |
Source: Public Records
Tax History Compared to Growth
Tax History
| Year | Tax Paid | Tax Assessment Tax Assessment Total Assessment is a certain percentage of the fair market value that is determined by local assessors to be the total taxable value of land and additions on the property. | Land | Improvement |
|---|---|---|---|---|
| 2024 | $4,261 | $97,480 | $20,160 | $77,320 |
| 2023 | $4,231 | $97,475 | $20,160 | $77,315 |
| 2022 | $3,812 | $66,750 | $17,260 | $49,490 |
| 2021 | $3,580 | $66,750 | $17,260 | $49,490 |
| 2020 | $3,544 | $66,750 | $17,260 | $49,490 |
| 2019 | $3,247 | $53,170 | $13,790 | $39,380 |
| 2018 | $3,378 | $51,560 | $13,790 | $37,770 |
| 2017 | $3,279 | $51,560 | $13,790 | $37,770 |
| 2016 | $3,517 | $53,840 | $12,780 | $41,060 |
| 2015 | $3,547 | $53,840 | $12,780 | $41,060 |
| 2014 | $3,547 | $53,840 | $12,780 | $41,060 |
| 2013 | $1,776 | $56,665 | $13,440 | $43,225 |
Source: Public Records
Map
Nearby Homes
- 322 Fairway Cir
- 353 Shell Ct E
- 424 Cumberland Dr
- 469 Cumberland Dr
- 4780 Etna Rd Unit 782
- 571 S Hamilton Rd
- 547 Country Club Rd
- 4489 Saint Margaret Ln
- 451 Beaver Ave
- 4653 Kae Ave
- 4662 Jae Ave
- 110 Ironclad Dr Unit 9
- 686 Fairway Blvd
- 579 Westphal Ave
- 4232 Mayflower Blvd
- 185 Prairiecreek Way Unit 185
- 4212 Seigman Ave
- 855 Dimson Dr E
- 4148 Elbern Ave
- 931 Antwerp Rd
- 239 Fairway Blvd
- 229 Fairway Blvd
- 4800 Ashley Ave
- 245 Fairway Blvd
- 4820 Ashley Ave
- 225 Fairway Blvd Unit A-E
- 225 Fairway Blvd
- 227 Fairway Blvd
- 4794 Ashley Ave
- 4830 Ashley Ave
- 253 Fairway Blvd
- 223 Fairway Blvd
- 4840 Ashley Ave
- 4793 Ashley Ave
- 257 Fairway Blvd
- 4799 Ashley Ave
- 307 Briarwood Dr
- 4850 Ashley Ave
- 181 Fairway Blvd
- 4839 Ashley Ave