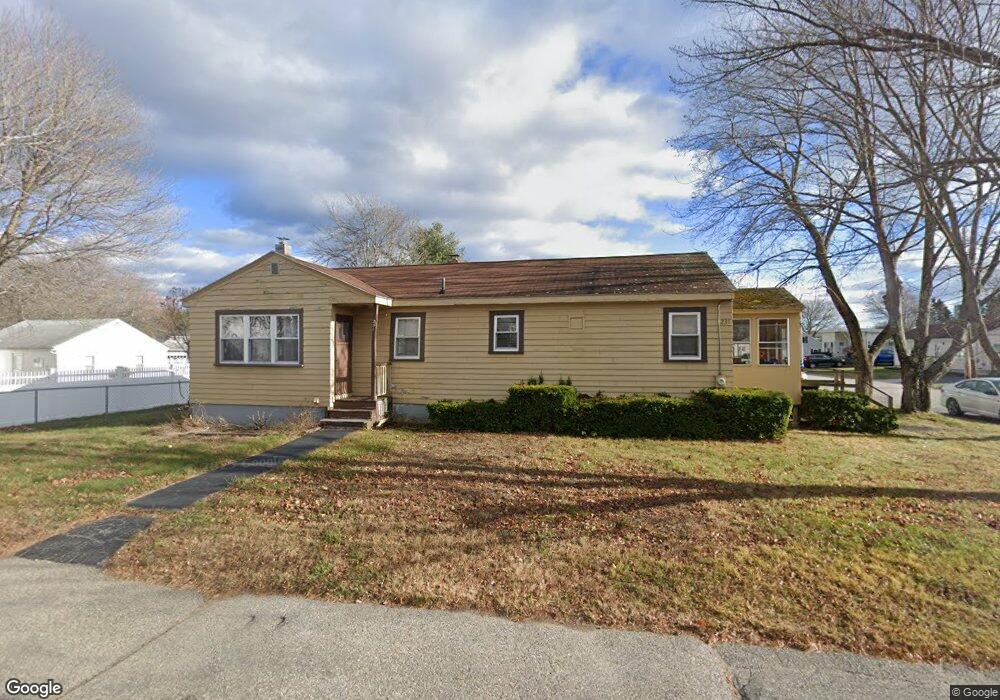
231 Hill St Biddeford, ME 04005
Estimated Value: $389,000 - $424,000
3
Beds
1
Bath
1,160
Sq Ft
$353/Sq Ft
Est. Value
About This Home
This home is located at 231 Hill St, Biddeford, ME 04005 and is currently estimated at $409,331, approximately $352 per square foot. 231 Hill St is a home located in York County with nearby schools including John F Kennedy Memorial School, Biddeford Primary School, and Biddeford Intermediate School.
Ownership History
Date
Name
Owned For
Owner Type
Purchase Details
Closed on
Mar 3, 2024
Sold by
Hoak Daniel E
Bought by
Gallant Katherine A and Hoak Daniel E
Current Estimated Value
Purchase Details
Closed on
Jun 13, 2014
Sold by
Jacques Cindi
Bought by
Hoak Daniel E
Purchase Details
Closed on
Jun 26, 2008
Sold by
Petrin Therese B and Petrin Theresa B
Bought by
Jacques Cindi and Hoak Daniel
Home Financials for this Owner
Home Financials are based on the most recent Mortgage that was taken out on this home.
Original Mortgage
$163,200
Interest Rate
6.07%
Mortgage Type
Purchase Money Mortgage
Create a Home Valuation Report for This Property
The Home Valuation Report is an in-depth analysis detailing your home's value as well as a comparison with similar homes in the area
Home Values in the Area
Average Home Value in this Area
Purchase History
| Date | Buyer | Sale Price | Title Company |
|---|---|---|---|
| Gallant Katherine A | -- | None Available | |
| Gallant Katherine A | -- | None Available | |
| Hoak Daniel E | -- | -- | |
| Jacques Cindi | -- | -- | |
| Jacques Cindi | -- | -- |
Source: Public Records
Mortgage History
| Date | Status | Borrower | Loan Amount |
|---|---|---|---|
| Previous Owner | Jacques Cindi | $163,200 |
Source: Public Records
Tax History
| Year | Tax Paid | Tax Assessment Tax Assessment Total Assessment is a certain percentage of the fair market value that is determined by local assessors to be the total taxable value of land and additions on the property. | Land | Improvement |
|---|---|---|---|---|
| 2025 | $5,111 | $342,100 | $147,600 | $194,500 |
| 2024 | $4,811 | $338,300 | $147,600 | $190,700 |
| 2023 | $4,403 | $335,600 | $144,900 | $190,700 |
| 2022 | $3,871 | $235,900 | $81,700 | $154,200 |
| 2021 | $3,670 | $201,300 | $69,200 | $132,100 |
| 2020 | $3,699 | $184,500 | $62,800 | $121,700 |
| 2019 | $3,686 | $184,500 | $62,800 | $121,700 |
| 2018 | $3,635 | $184,500 | $62,800 | $121,700 |
| 2017 | $3,388 | $168,800 | $62,800 | $106,000 |
| 2016 | $3,352 | $168,800 | $62,800 | $106,000 |
| 2015 | $3,092 | $168,800 | $62,800 | $106,000 |
| 2014 | $3,016 | $168,800 | $62,800 | $106,000 |
| 2013 | -- | $172,400 | $59,400 | $113,000 |
Source: Public Records
Map
Nearby Homes
Your Personal Tour Guide
Ask me questions while you tour the home.