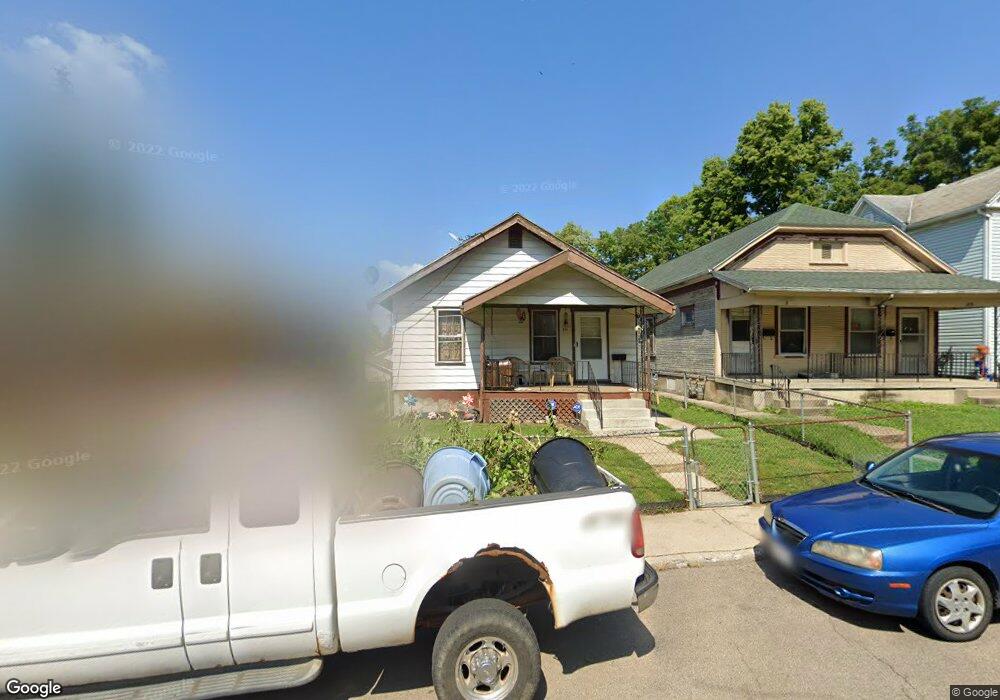
231 Livingston Ave Dayton, OH 45403
Burkhardt NeighborhoodEstimated Value: $72,395 - $103,000
2
Beds
1
Bath
947
Sq Ft
$97/Sq Ft
Est. Value
About This Home
This home is located at 231 Livingston Ave, Dayton, OH 45403 and is currently estimated at $91,599, approximately $96 per square foot. 231 Livingston Ave is a home located in Montgomery County with nearby schools including Ruskin Elementary School, Kiser Elementary, and Horizon Science Academy Dayton Downtown.
Ownership History
Date
Name
Owned For
Owner Type
Purchase Details
Closed on
Jul 13, 2019
Sold by
Doseck Jack and Doseck Veronica
Bought by
Cole Steven and Cole Jaime
Current Estimated Value
Purchase Details
Closed on
May 5, 2009
Sold by
Fannie Mae
Bought by
Doseck Jack
Purchase Details
Closed on
Jan 5, 2009
Sold by
Copps Samantha
Bought by
Fanniemae and Federal National Mortgage Association
Purchase Details
Closed on
Mar 1, 2006
Sold by
Tsm Properties Ltd
Bought by
Copps Samantha
Purchase Details
Closed on
Dec 11, 2003
Sold by
Wilburn Terry D and Jones Herman
Bought by
Tsm Properties Ltd
Purchase Details
Closed on
May 29, 1998
Sold by
Oldham David L
Bought by
Wilburn Terry D and Jones Herman
Home Financials for this Owner
Home Financials are based on the most recent Mortgage that was taken out on this home.
Original Mortgage
$36,900
Interest Rate
7.27%
Create a Home Valuation Report for This Property
The Home Valuation Report is an in-depth analysis detailing your home's value as well as a comparison with similar homes in the area
Home Values in the Area
Average Home Value in this Area
Purchase History
| Date | Buyer | Sale Price | Title Company |
|---|---|---|---|
| Cole Steven | $21,000 | Landmark Ttl Agcy South Inc | |
| Doseck Jack | $9,300 | Ohio Title Corporation | |
| Fanniemae | $20,000 | Attorney | |
| Copps Samantha | $33,400 | None Available | |
| Tsm Properties Ltd | $38,300 | -- | |
| Wilburn Terry D | $41,000 | -- | |
| Wilburn Terry D | $41,000 | -- |
Source: Public Records
Mortgage History
| Date | Status | Borrower | Loan Amount |
|---|---|---|---|
| Previous Owner | Wilburn Terry D | $36,900 |
Source: Public Records
Tax History Compared to Growth
Tax History
| Year | Tax Paid | Tax Assessment Tax Assessment Total Assessment is a certain percentage of the fair market value that is determined by local assessors to be the total taxable value of land and additions on the property. | Land | Improvement |
|---|---|---|---|---|
| 2024 | $864 | $8,410 | $1,640 | $6,770 |
| 2023 | $864 | $8,410 | $1,640 | $6,770 |
| 2022 | $565 | $7,360 | $1,440 | $5,920 |
| 2021 | $562 | $7,360 | $1,440 | $5,920 |
| 2020 | $561 | $7,360 | $1,440 | $5,920 |
| 2019 | $550 | $6,410 | $1,440 | $4,970 |
| 2018 | $551 | $6,410 | $1,440 | $4,970 |
| 2017 | $547 | $6,410 | $1,440 | $4,970 |
| 2016 | $598 | $6,710 | $1,440 | $5,270 |
| 2015 | $725 | $6,710 | $1,440 | $5,270 |
| 2014 | $725 | $6,710 | $1,440 | $5,270 |
| 2012 | -- | $11,420 | $2,740 | $8,680 |
Source: Public Records
Map
Nearby Homes
- 227 Livingston Ave Unit 225
- 115 Oaklawn Ave
- 40 Klee Ave
- 800 Linden Ave
- 133 Linsan Ct
- 631 Greenlawn Ave
- 523 Carlisle Ave
- 1323 Huffman Ave
- 223 Pleasant Ave
- 1345 Jordan Ave
- 1609 Xenia Ave
- 607 Carlisle Ave
- 636 Wilfred Ave
- 1024 Haviland Ave
- 630 Carlisle Ave
- 1018 Haviland Ave
- 626 Creighton Ave
- 621 Creighton Ave
- 755 Huffman Ave
- 662 Carlisle Ave
- 235 Livingston Ave
- 225 Livingston Ave
- 225 Livingston Ave Unit 225 & 227
- 227 Livingston Ave
- 237 Livingston Ave
- 223 Livingston Ave
- 250 Livingston Ave
- 241 Livingston Ave
- 219 Livingston Ave
- 232 Klee Ave
- 236 Klee Ave
- 245 Livingston Ave
- 228 Klee Ave
- 215 Livingston Ave
- 240 Klee Ave
- 249 Livingston Ave
- 244 Klee Ave
- 209 Livingston Ave
- 222 Klee Ave Unit 222C
- 222 Klee Ave