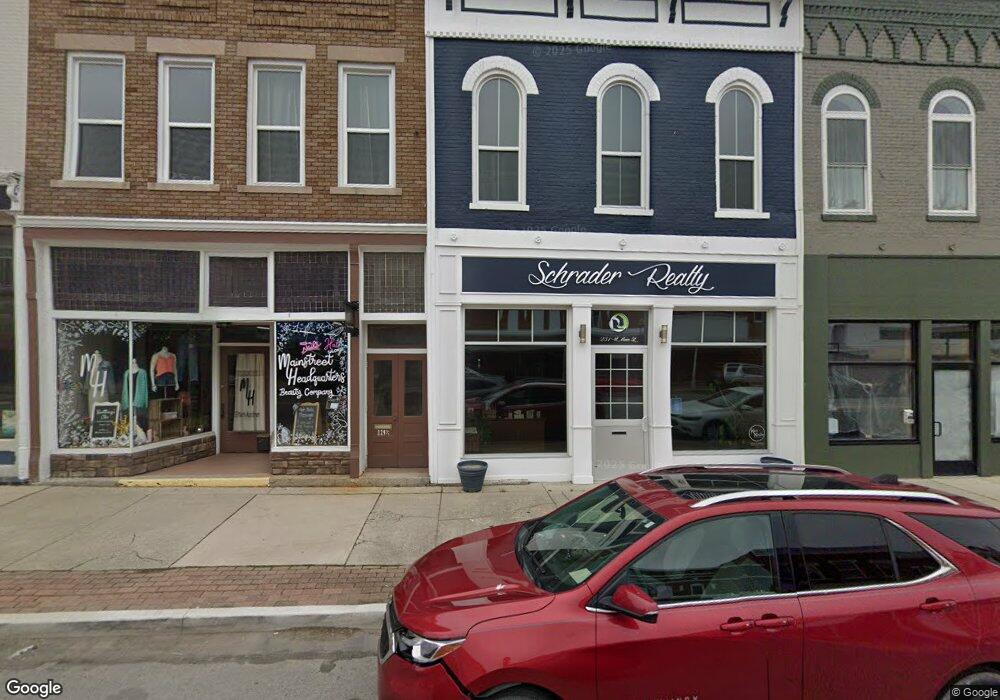
231 N Main St Delphos, OH 45833
Estimated Value: $74,146
Studio
1
Bath
4,600
Sq Ft
$16/Sq Ft
Est. Value
About This Home
This home is located at 231 N Main St, Delphos, OH 45833 and is currently priced at $74,146, approximately $16 per square foot. 231 N Main St is a home located in Allen County with nearby schools including Delphos St. John's High School and Delphos St. John's Elementary School.
Ownership History
Date
Name
Owned For
Owner Type
Purchase Details
Closed on
Nov 14, 2019
Sold by
Schwieterman M Helen
Bought by
Kenkade Llc
Current Estimated Value
Purchase Details
Closed on
Jun 19, 2001
Sold by
Rl Yocum Realty Co
Bought by
Schwieterman Edgar D and Helen Schwieterman M
Purchase Details
Closed on
Oct 8, 1993
Sold by
Dickerhoff Sally A
Bought by
R L Yocum Realty Co
Purchase Details
Closed on
Sep 13, 1993
Sold by
Dickerhoff Max L
Bought by
Dickerhoff Sally A
Purchase Details
Closed on
Feb 5, 1987
Bought by
Dickerhoff Max L
Create a Home Valuation Report for This Property
The Home Valuation Report is an in-depth analysis detailing your home's value as well as a comparison with similar homes in the area
Home Values in the Area
Average Home Value in this Area
Purchase History
| Date | Buyer | Sale Price | Title Company |
|---|---|---|---|
| Kenkade Llc | $5,000 | None Available | |
| Schwieterman Edgar D | $40,000 | -- | |
| R L Yocum Realty Co | $18,500 | -- | |
| Dickerhoff Sally A | -- | -- | |
| Dickerhoff Max L | $30,000 | -- |
Source: Public Records
Tax History
| Year | Tax Paid | Tax Assessment Tax Assessment Total Assessment is a certain percentage of the fair market value that is determined by local assessors to be the total taxable value of land and additions on the property. | Land | Improvement |
|---|---|---|---|---|
| 2024 | $1,000 | $18,350 | $2,840 | $15,510 |
| 2023 | $968 | $16,700 | $2,590 | $14,110 |
| 2022 | $998 | $16,700 | $2,590 | $14,110 |
| 2021 | $1,005 | $16,700 | $2,590 | $14,110 |
| 2020 | $947 | $17,160 | $3,470 | $13,690 |
| 2019 | $947 | $17,160 | $3,470 | $13,690 |
| 2018 | $932 | $17,160 | $3,470 | $13,690 |
| 2017 | $914 | $17,160 | $3,470 | $13,690 |
| 2016 | $932 | $17,160 | $3,470 | $13,690 |
| 2015 | $917 | $17,160 | $3,470 | $13,690 |
| 2014 | $891 | $18,000 | $3,470 | $14,530 |
| 2013 | $866 | $18,000 | $3,470 | $14,530 |
Source: Public Records
Map
Nearby Homes
- 201 E 5th St
- 221 S Main St
- 610 N Washington St
- 629 N Main St
- 702 N Main St
- 409 N Bredeick St
- 424 S Canal St
- 628 N Pierce St
- 709 W 4th St
- 483 S Franklin St
- 537 / 539 Toomey
- 821 E 3rd St
- 827 S Washington St
- 10429 Ohio 66
- 1000 Colettas Way
- 7110 Elida Rd
- 6800 N Defiance Trail
- 8448 Elida Rd
- 112 W Railroad St
- 608 N Adams St
Your Personal Tour Guide
Ask me questions while you tour the home.