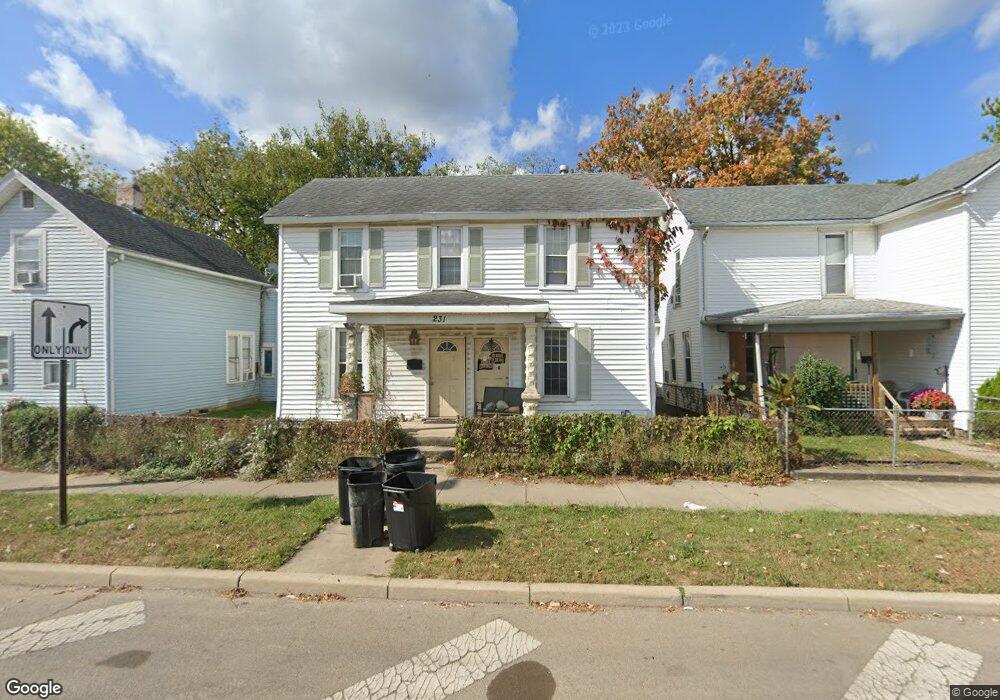
231 N Yellow Springs St Springfield, OH 45504
Estimated Value: $42,000 - $91,246
4
Beds
1
Bath
1,572
Sq Ft
$42/Sq Ft
Est. Value
About This Home
This home is located at 231 N Yellow Springs St, Springfield, OH 45504 and is currently estimated at $65,812, approximately $41 per square foot. 231 N Yellow Springs St is a home located in Clark County with nearby schools including Snowhill Elementary School, Roosevelt Middle School, and Springfield High School.
Ownership History
Date
Name
Owned For
Owner Type
Purchase Details
Closed on
Nov 3, 2023
Sold by
Hafle Daniel D
Bought by
Martinez Ginez Daniel
Current Estimated Value
Purchase Details
Closed on
Dec 6, 2005
Sold by
The Cit Group Consumer Finance Inc
Bought by
Hafle Daniel D
Purchase Details
Closed on
Apr 21, 2005
Sold by
Hyatt Keith
Bought by
The Cit Group/Consumer Finance Inc
Purchase Details
Closed on
Mar 15, 2002
Sold by
Macgillivray David E and Macgillivray Ann Margaret
Bought by
Hyatt Keith
Home Financials for this Owner
Home Financials are based on the most recent Mortgage that was taken out on this home.
Original Mortgage
$46,575
Interest Rate
9.49%
Mortgage Type
Stand Alone First
Purchase Details
Closed on
Oct 7, 1996
Sold by
Ferryman Mary L
Bought by
Macgillivray David E and Macgillivray Margaret
Create a Home Valuation Report for This Property
The Home Valuation Report is an in-depth analysis detailing your home's value as well as a comparison with similar homes in the area
Home Values in the Area
Average Home Value in this Area
Purchase History
| Date | Buyer | Sale Price | Title Company |
|---|---|---|---|
| Martinez Ginez Daniel | $39,000 | None Listed On Document | |
| Hafle Daniel D | $13,300 | None Available | |
| The Cit Group/Consumer Finance Inc | $13,400 | -- | |
| Hyatt Keith | $22,800 | Express Title Services Of Oh | |
| Macgillivray David E | $14,000 | -- |
Source: Public Records
Mortgage History
| Date | Status | Borrower | Loan Amount |
|---|---|---|---|
| Previous Owner | Hyatt Keith | $46,575 |
Source: Public Records
Tax History Compared to Growth
Tax History
| Year | Tax Paid | Tax Assessment Tax Assessment Total Assessment is a certain percentage of the fair market value that is determined by local assessors to be the total taxable value of land and additions on the property. | Land | Improvement |
|---|---|---|---|---|
| 2024 | $1,116 | $14,580 | $3,350 | $11,230 |
| 2023 | $720 | $14,580 | $3,350 | $11,230 |
| 2022 | $738 | $14,580 | $3,350 | $11,230 |
| 2021 | $662 | $12,050 | $2,770 | $9,280 |
| 2020 | $664 | $12,050 | $2,770 | $9,280 |
| 2019 | $665 | $12,050 | $2,770 | $9,280 |
| 2018 | $750 | $13,040 | $3,260 | $9,780 |
| 2017 | $750 | $13,038 | $3,255 | $9,783 |
| 2016 | $751 | $13,038 | $3,255 | $9,783 |
| 2015 | $806 | $13,731 | $3,255 | $10,476 |
| 2014 | $803 | $13,731 | $3,255 | $10,476 |
| 2013 | $794 | $13,731 | $3,255 | $10,476 |
Source: Public Records
Map
Nearby Homes
- 522 W North St Unit 524
- 222 N Race St Unit 224
- 0 S Plum St
- 423 N Jackson St Unit 425
- 101`103 N Western
- 20 N Center St
- 1120 W High St
- 25 Mill Run Place
- 120 E Ward St
- 38 W High St Unit 3B
- 681 W Jefferson St Unit 683
- 317 S Plum St
- 1009 W High St
- 29 E Ward St
- 1009 N Lowry Ave
- 33-35 E Ward St
- 366 N Isabella St
- 1205 W High St
- 833 W Mulberry St
- 516 W Clark St
- 227 N Yellow Springs St
- 237 N Yellow Springs St Unit 239
- 221 N Yellow Springs St
- 517 Cedar St
- 301 N Yellow Springs St
- 217 N Yellow Springs St
- 303 N Yellow Springs St
- 521 Cedar St
- 309 N Yellow Springs St
- 516 Cedar St
- 520 Cedar St
- 527 Cedar St
- 315 N Yellow Springs St
- 526 Cedar St
- 319 N Yellow Springs St
- 234 N Race St
- 230 N Race St Unit 232
- 236 N Race St Unit 238
- 226 N Race St Unit 228
- 304 N Race St