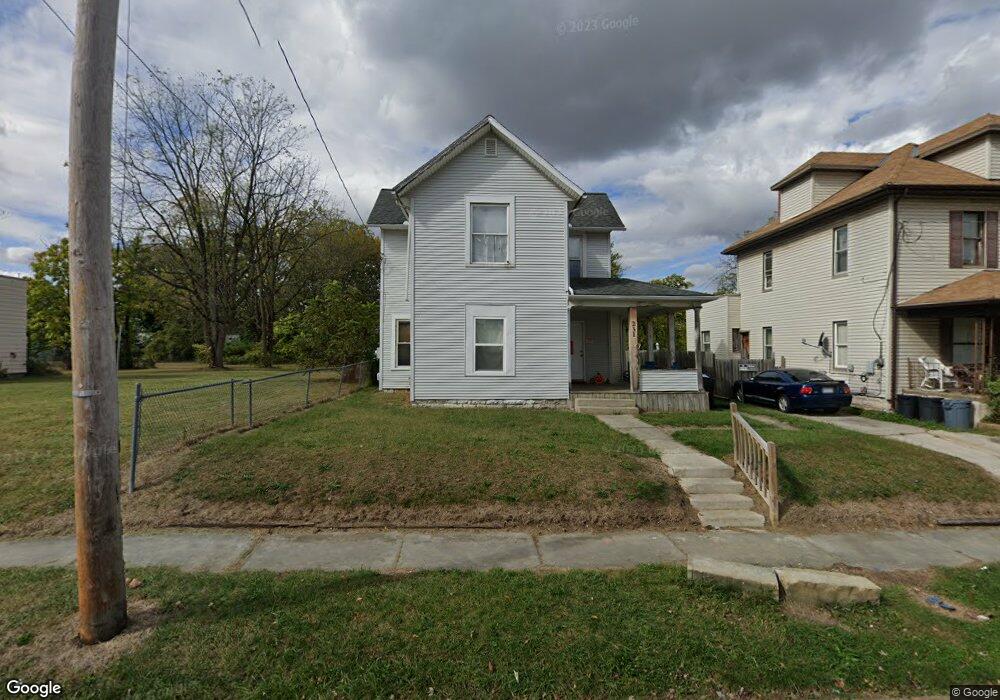
231 Olney Ave Marion, OH 43302
Estimated Value: $78,000 - $106,248
2
Beds
1
Bath
1,654
Sq Ft
$56/Sq Ft
Est. Value
About This Home
This home is located at 231 Olney Ave, Marion, OH 43302 and is currently estimated at $92,312, approximately $55 per square foot. 231 Olney Ave is a home located in Marion County with nearby schools including James A. Garfield Elementary School, Ulysses S. Grant Middle School, and Harding High School.
Ownership History
Date
Name
Owned For
Owner Type
Purchase Details
Closed on
Apr 3, 2023
Sold by
Marks Cory
Bought by
Marks Property Investments Llc
Current Estimated Value
Purchase Details
Closed on
Mar 5, 2021
Sold by
White Keith
Bought by
Marks Cory
Purchase Details
Closed on
Apr 8, 2019
Sold by
Davis Gianna Rose
Bought by
White Keith
Purchase Details
Closed on
May 6, 2016
Sold by
Ottaviano John
Bought by
Davis Gianna Rose and Burns Elizabeth
Purchase Details
Closed on
Feb 2, 2016
Sold by
Davis Rose Mary and Ottaviano Mary
Bought by
Ottaviano John
Purchase Details
Closed on
Aug 10, 2015
Sold by
J & R Land Company Inc
Bought by
Davis Rosemary and Ottaviano Mary
Purchase Details
Closed on
Dec 3, 2002
Bought by
Davis Gianna R
Purchase Details
Closed on
Jun 27, 2001
Bought by
Davis Gianna R
Purchase Details
Closed on
Aug 6, 1999
Bought by
Davis Gianna R
Purchase Details
Closed on
May 23, 1996
Bought by
Davis Gianna R
Create a Home Valuation Report for This Property
The Home Valuation Report is an in-depth analysis detailing your home's value as well as a comparison with similar homes in the area
Home Values in the Area
Average Home Value in this Area
Purchase History
| Date | Buyer | Sale Price | Title Company |
|---|---|---|---|
| Marks Property Investments Llc | -- | None Listed On Document | |
| Marks Cory | $1,800 | None Available | |
| White Keith | -- | None Available | |
| Davis Gianna Rose | $37,500 | None Available | |
| Ottaviano John | -- | Attorney | |
| Davis Rosemary | -- | Attorney | |
| Davis Gianna R | $15,000 | -- | |
| Davis Gianna R | $35,300 | -- | |
| Davis Gianna R | -- | -- | |
| Davis Gianna R | $43,000 | -- | |
| Davis Gianna R | $20,300 | -- |
Source: Public Records
Tax History Compared to Growth
Tax History
| Year | Tax Paid | Tax Assessment Tax Assessment Total Assessment is a certain percentage of the fair market value that is determined by local assessors to be the total taxable value of land and additions on the property. | Land | Improvement |
|---|---|---|---|---|
| 2024 | $2,137 | $20,110 | $1,510 | $18,600 |
| 2023 | $2,137 | $20,110 | $1,510 | $18,600 |
| 2022 | $1,168 | $20,110 | $1,510 | $18,600 |
| 2021 | $803 | $16,080 | $1,310 | $14,770 |
| 2020 | $742 | $16,080 | $1,310 | $14,770 |
| 2019 | $621 | $16,080 | $1,310 | $14,770 |
| 2018 | $1,276 | $13,400 | $1,300 | $12,100 |
| 2017 | $1,392 | $13,400 | $1,300 | $12,100 |
| 2016 | $535 | $13,400 | $1,300 | $12,100 |
| 2015 | $535 | $13,120 | $1,240 | $11,880 |
| 2014 | $1,087 | $13,120 | $1,240 | $11,880 |
| 2012 | $503 | $12,220 | $1,790 | $10,430 |
Source: Public Records
Map
Nearby Homes
- 429 W Columbia St
- 374 Nunin Ct
- 302 Blaine Ave
- 198 Windsor St
- 325 Holmes Place
- 178 Leader St
- 341 Girard Ave
- 213 Sharp St
- 403 Uncapher Ave
- 354 Bellefontaine Ave
- 545 Blaine Ave
- 426 Bellefontaine Ave
- 512 Henry St
- 546 Cherry St
- 593 Windsor St
- 343 Commercial St
- 559 Pearl St
- 347 Mary St
- 618 Windsor St
- 236 Silver St
- 225 Olney Ave
- 237 Olney Ave
- 219 Olney Ave
- 249 Olney Ave
- 243 Olney Ave
- 213 Olney Ave
- 230 Park Blvd
- 207 Olney Ave
- 238 Park Blvd
- 222 Park Blvd
- 248 Park Blvd
- 214 Park Blvd
- 261 Olney Ave
- 218 Olney Ave Unit 220
- 212 Olney Ave
- 212 Olney Ave Unit 212
- 212 Olney Ave Unit 218
- 248 Olney Ave
- 195 Olney Ave
- 256 Park Blvd