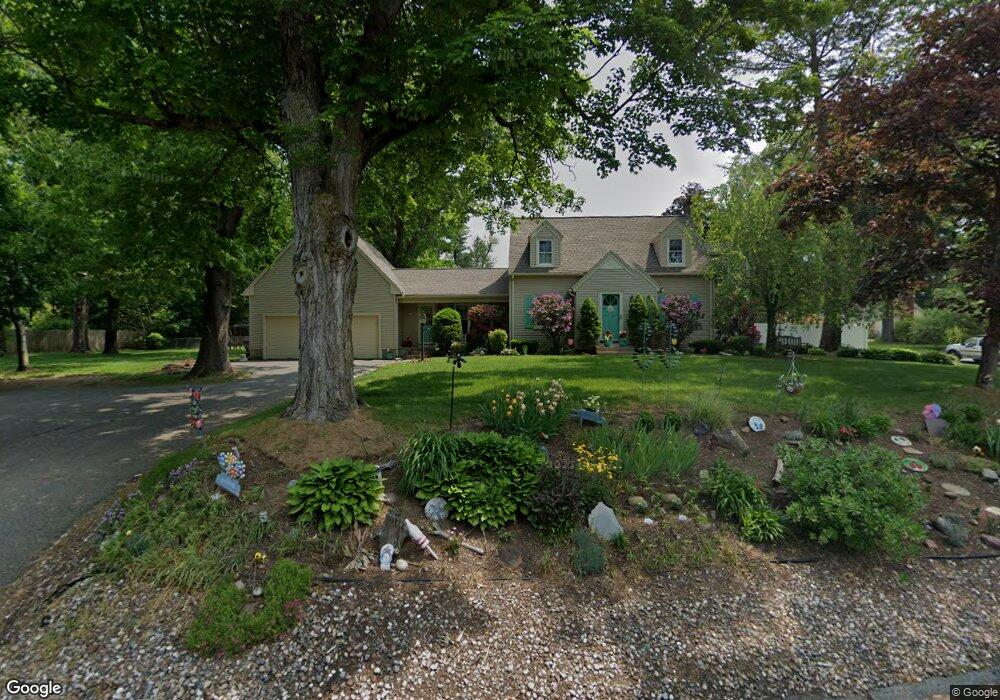
231 Parker St East Longmeadow, MA 01028
Estimated Value: $437,903 - $472,000
2
Beds
2
Baths
2,415
Sq Ft
$190/Sq Ft
Est. Value
About This Home
This home is located at 231 Parker St, East Longmeadow, MA 01028 and is currently estimated at $457,726, approximately $189 per square foot. 231 Parker St is a home located in Hampden County with nearby schools including Meadowbrook Elementary School, Birchland Park Middle School, and East Longmeadow High School.
Ownership History
Date
Name
Owned For
Owner Type
Purchase Details
Closed on
Apr 10, 2008
Sold by
Meron Gail E
Bought by
Meron-Stone Cynthia J and Porway Cynthia J
Current Estimated Value
Create a Home Valuation Report for This Property
The Home Valuation Report is an in-depth analysis detailing your home's value as well as a comparison with similar homes in the area
Home Values in the Area
Average Home Value in this Area
Purchase History
| Date | Buyer | Sale Price | Title Company |
|---|---|---|---|
| Meron-Stone Cynthia J | -- | -- |
Source: Public Records
Tax History Compared to Growth
Tax History
| Year | Tax Paid | Tax Assessment Tax Assessment Total Assessment is a certain percentage of the fair market value that is determined by local assessors to be the total taxable value of land and additions on the property. | Land | Improvement |
|---|---|---|---|---|
| 2025 | $6,383 | $345,400 | $130,900 | $214,500 |
| 2024 | $6,100 | $329,000 | $130,900 | $198,100 |
| 2023 | $5,739 | $298,900 | $117,800 | $181,100 |
| 2022 | $5,476 | $269,900 | $106,500 | $163,400 |
| 2021 | $5,370 | $255,000 | $98,400 | $156,600 |
| 2020 | $5,143 | $246,800 | $98,400 | $148,400 |
| 2019 | $4,926 | $239,700 | $95,400 | $144,300 |
| 2018 | $4,791 | $228,800 | $95,400 | $133,400 |
| 2017 | $4,731 | $227,800 | $93,900 | $133,900 |
| 2016 | $4,720 | $223,500 | $91,000 | $132,500 |
| 2015 | $4,631 | $223,500 | $91,000 | $132,500 |
Source: Public Records
Map
Nearby Homes
- 37 Bent Tree Dr
- 241 Hampden Rd
- 15 Fernwood Dr
- 350 Parker St
- 404 Parker St
- 19 Deerfield Cir
- 75 Marci Ave
- 57 Marci Ave
- 21 Old Orchard Rd
- Lot B Jeffery Ln S
- 503 Parker St
- 8 Happy Acres Ln
- 2 Happy Acres Ln
- 75 Lee St
- 88 Tall Pines Rd Unit 88
- 8 Evergreen Terrace
- 152 Brookhaven Dr
- 2 Southwood Cir
- 46 Chestnut Street Place
- 14 High Meadow Cir