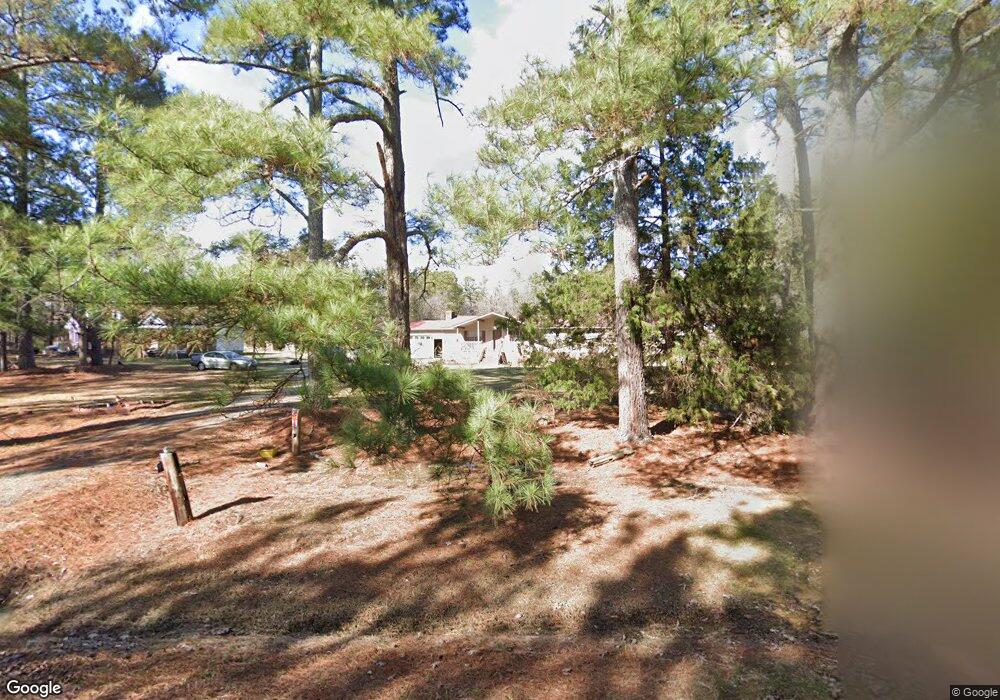
231 Richardson Rd Pittsboro, NC 27312
Estimated Value: $363,814 - $438,000
3
Beds
2
Baths
1,456
Sq Ft
$287/Sq Ft
Est. Value
About This Home
This home is located at 231 Richardson Rd, Pittsboro, NC 27312 and is currently estimated at $417,454, approximately $286 per square foot. 231 Richardson Rd is a home located in Chatham County with nearby schools including Pittsboro Elementary School, George Moses Horton Middle School, and Northwood High.
Create a Home Valuation Report for This Property
The Home Valuation Report is an in-depth analysis detailing your home's value as well as a comparison with similar homes in the area
Home Values in the Area
Average Home Value in this Area
Tax History Compared to Growth
Tax History
| Year | Tax Paid | Tax Assessment Tax Assessment Total Assessment is a certain percentage of the fair market value that is determined by local assessors to be the total taxable value of land and additions on the property. | Land | Improvement |
|---|---|---|---|---|
| 2025 | $2,527 | $333,779 | $49,575 | $284,204 |
| 2024 | $2,527 | $241,257 | $41,643 | $199,614 |
| 2023 | $2,230 | $241,257 | $41,643 | $199,614 |
| 2022 | $2,035 | $241,257 | $41,643 | $199,614 |
| 2021 | $2,035 | $241,257 | $41,643 | $199,614 |
| 2020 | $1,538 | $178,258 | $35,328 | $142,930 |
| 2019 | $1,538 | $178,258 | $35,328 | $142,930 |
| 2018 | $1,463 | $178,258 | $35,328 | $142,930 |
| 2017 | $1,463 | $178,258 | $35,328 | $142,930 |
| 2016 | $1,179 | $139,348 | $27,600 | $111,748 |
| 2015 | $1,162 | $139,348 | $27,600 | $111,748 |
| 2014 | $1,153 | $139,348 | $27,600 | $111,748 |
| 2013 | -- | $139,348 | $27,600 | $111,748 |
Source: Public Records
Map
Nearby Homes
- 652 Richardson Rd
- 194 Jack Alston Rd
- 2b Lucy Mae Page Rd
- 75 Clarence Brooks Rd
- 126 Roberson Creek Rd
- 323 Wagon Trace
- 1838 Alex Cockman Rd
- 1545 Alex Cockman Rd
- 000 Alston Chapel Rd
- 001 Turn Key Way
- 0 Nc 87 Hwy Unit 2491586
- 190 Louise Jenkins Rd
- 1191 Old Sanford Rd
- 501 U S 15
- 1701 Mitchells Chapel Rd
- 88 Daisy Scurlock Rd
- 0 N Carolina 902
- 00 N Carolina 902
- Lot 1 B Turkey Buzzard Ln
- Lot 1 D Turkey Buzzard Ln
- 197 Richardson Rd
- 259 Richardson Rd
- 353 Richardson Rd
- 125 Richardson Rd
- 125 Richardson Rd
- 55 Richardson Rd
- 405 Richardson Rd
- 431 Richardson Rd
- 27 Richardson Rd
- 4235 Nc 902 Hwy
- 4235 Nc 902 Hwy Unit A
- 4304 Nc Highway 902
- 4235 Nc-902
- 4275 N Carolina 902
- 4336 Nc Highway 902
- 4275 Nc Highway 902
- 4297 N Carolina 902
- 4297 Nc Highway 902
- 4297 Nc Highway 902
- 4299 Nc Highway 902