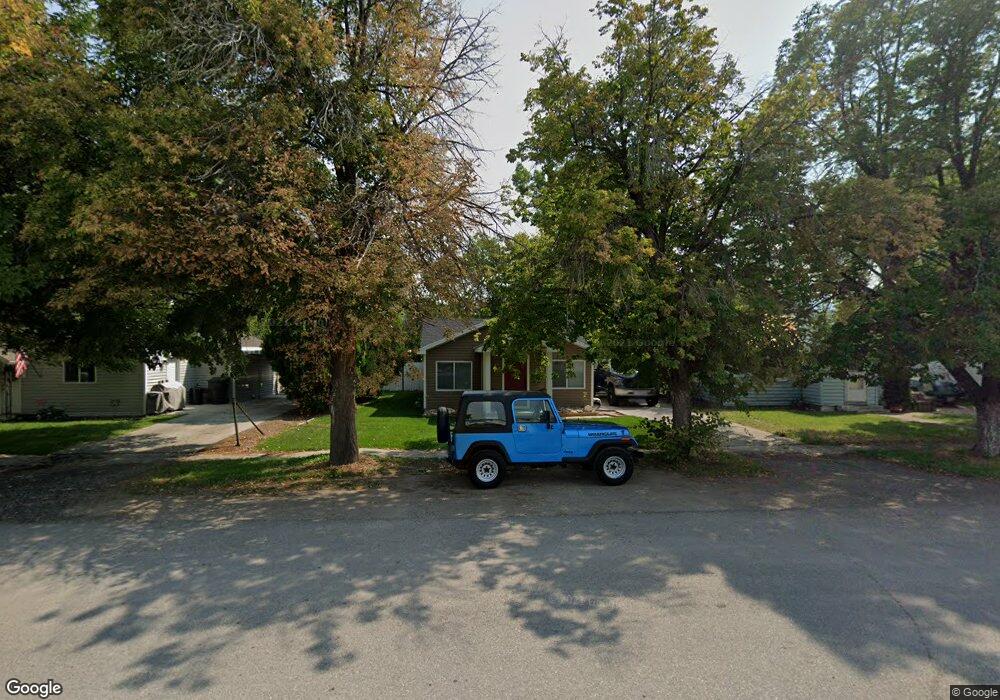
231 S 200 W Tremonton, UT 84337
Estimated Value: $301,000 - $334,000
4
Beds
1
Bath
1,799
Sq Ft
$176/Sq Ft
Est. Value
About This Home
This home is located at 231 S 200 W, Tremonton, UT 84337 and is currently estimated at $317,454, approximately $176 per square foot. 231 S 200 W is a home located in Box Elder County with nearby schools including McKinley School, Alice C. Harris Intermediate School, and Bear River Middle School.
Ownership History
Date
Name
Owned For
Owner Type
Purchase Details
Closed on
Jan 14, 2022
Sold by
Phlllip Flelding Tanner
Bought by
Stoker Kyle R and Stoker Darla L
Current Estimated Value
Home Financials for this Owner
Home Financials are based on the most recent Mortgage that was taken out on this home.
Original Mortgage
$304,040
Outstanding Balance
$279,990
Interest Rate
3.05%
Mortgage Type
New Conventional
Estimated Equity
$37,464
Purchase Details
Closed on
Jun 15, 2020
Sold by
Scott Daniel M and Scott Nancy K
Bought by
Fielding Tanner Phillip
Home Financials for this Owner
Home Financials are based on the most recent Mortgage that was taken out on this home.
Original Mortgage
$196,969
Interest Rate
3.2%
Mortgage Type
New Conventional
Purchase Details
Closed on
Apr 20, 2018
Sold by
Hanson Anette and Scott Danied
Bought by
Scott Daniel M and Scott Nancy K
Purchase Details
Closed on
Nov 21, 2012
Sold by
Scott David A and Scott Ruby M
Bought by
Scott David Arthur and Scott Ruby Marble
Create a Home Valuation Report for This Property
The Home Valuation Report is an in-depth analysis detailing your home's value as well as a comparison with similar homes in the area
Home Values in the Area
Average Home Value in this Area
Purchase History
| Date | Buyer | Sale Price | Title Company |
|---|---|---|---|
| Stoker Kyle R | -- | Us Title | |
| Stoker Kyle R | -- | Us Title | |
| Fielding Tanner Phillip | -- | American Secure Ttl Tremonto | |
| Scott Daniel M | -- | Northern Title Company | |
| Scott David Arthur | -- | Box Elder Land Title Co |
Source: Public Records
Mortgage History
| Date | Status | Borrower | Loan Amount |
|---|---|---|---|
| Open | Stoker Kyle R | $304,040 | |
| Previous Owner | Fielding Tanner Phillip | $196,969 |
Source: Public Records
Tax History Compared to Growth
Tax History
| Year | Tax Paid | Tax Assessment Tax Assessment Total Assessment is a certain percentage of the fair market value that is determined by local assessors to be the total taxable value of land and additions on the property. | Land | Improvement |
|---|---|---|---|---|
| 2025 | $1,660 | $282,528 | $105,000 | $177,528 |
| 2024 | $1,660 | $281,618 | $105,000 | $176,618 |
| 2023 | $1,643 | $273,644 | $100,000 | $173,644 |
| 2022 | $1,102 | $104,599 | $16,500 | $88,099 |
| 2021 | $991 | $120,409 | $30,000 | $90,409 |
| 2020 | $796 | $120,409 | $30,000 | $90,409 |
| 2019 | $750 | $60,504 | $16,500 | $44,004 |
| 2018 | $516 | $38,719 | $13,750 | $24,969 |
| 2017 | $542 | $70,399 | $13,750 | $45,399 |
| 2016 | $537 | $37,530 | $13,750 | $23,780 |
| 2015 | $502 | $35,369 | $13,750 | $21,619 |
| 2014 | $502 | $34,339 | $13,750 | $20,589 |
| 2013 | -- | $33,927 | $13,338 | $20,589 |
Source: Public Records
Map
Nearby Homes