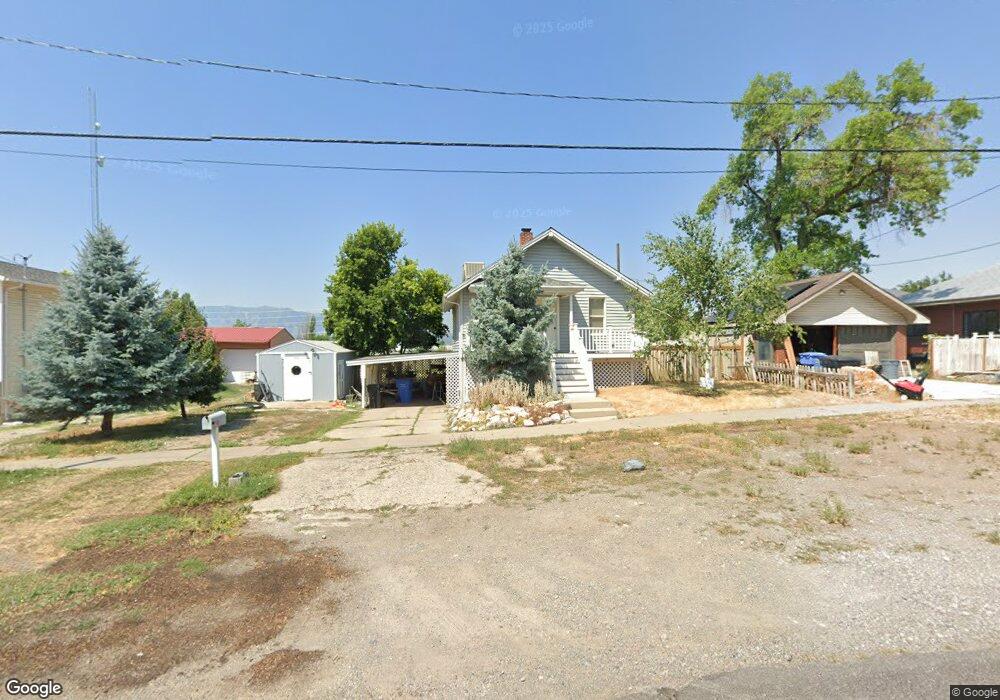
231 S 500 W Logan, UT 84321
Woodruff NeighborhoodEstimated Value: $287,000 - $332,326
3
Beds
2
Baths
1,344
Sq Ft
$236/Sq Ft
Est. Value
About This Home
This home is located at 231 S 500 W, Logan, UT 84321 and is currently estimated at $316,582, approximately $235 per square foot. 231 S 500 W is a home located in Cache County with nearby schools including Woodruff School, Mount Logan Middle School, and Logan High School.
Ownership History
Date
Name
Owned For
Owner Type
Purchase Details
Closed on
Sep 28, 2021
Sold by
Rasmussen Tyler C and Rasmussen Randi L
Bought by
Morgan Eli and Black Brittany
Current Estimated Value
Home Financials for this Owner
Home Financials are based on the most recent Mortgage that was taken out on this home.
Original Mortgage
$271,600
Outstanding Balance
$247,674
Interest Rate
2.8%
Mortgage Type
New Conventional
Estimated Equity
$68,908
Purchase Details
Closed on
Jan 28, 2018
Sold by
Parkinson Jade Lin and Parkinson Luke H
Bought by
Rasmussen Tyler C
Purchase Details
Closed on
Oct 25, 2017
Sold by
Rasmussen Tyler C
Bought by
Rasmussen Tyler C and Rasmussen Randil L
Home Financials for this Owner
Home Financials are based on the most recent Mortgage that was taken out on this home.
Original Mortgage
$167,902
Interest Rate
3.9%
Mortgage Type
FHA
Purchase Details
Closed on
Oct 19, 2017
Sold by
Parkinson Luke and Parkinson Jade
Bought by
Rasmussen Tyler C
Home Financials for this Owner
Home Financials are based on the most recent Mortgage that was taken out on this home.
Original Mortgage
$167,902
Interest Rate
3.9%
Mortgage Type
FHA
Purchase Details
Closed on
Jun 20, 2012
Sold by
Nielson Amy and Nielson Jeffrey R
Bought by
Parkinson Jade Lin and Parkinson Luke H
Home Financials for this Owner
Home Financials are based on the most recent Mortgage that was taken out on this home.
Original Mortgage
$106,534
Interest Rate
4.65%
Mortgage Type
FHA
Purchase Details
Closed on
Oct 26, 2009
Sold by
Lrc Properties Llc
Bought by
Nielson Amy and Nielson Jeffrey R
Home Financials for this Owner
Home Financials are based on the most recent Mortgage that was taken out on this home.
Original Mortgage
$89,200
Interest Rate
5%
Mortgage Type
New Conventional
Purchase Details
Closed on
May 11, 2009
Sold by
Lasalle Bank National Association
Bought by
Lrc Properties Llc
Purchase Details
Closed on
Mar 24, 2009
Sold by
Reese Helen S and Reese Jim
Bought by
Lasalle Bank National Association
Purchase Details
Closed on
Jul 6, 2007
Sold by
Reese Jim and Reese Sue
Bought by
Reese Helen S and Reese Jim
Home Financials for this Owner
Home Financials are based on the most recent Mortgage that was taken out on this home.
Original Mortgage
$112,000
Interest Rate
6.51%
Mortgage Type
New Conventional
Create a Home Valuation Report for This Property
The Home Valuation Report is an in-depth analysis detailing your home's value as well as a comparison with similar homes in the area
Home Values in the Area
Average Home Value in this Area
Purchase History
| Date | Buyer | Sale Price | Title Company |
|---|---|---|---|
| Morgan Eli | -- | American Secure Title Logan | |
| Rasmussen Tyler C | -- | -- | |
| Rasmussen Tyler C | -- | Hickman Land Title Co | |
| Rasmussen Tyler C | -- | Hickman Land Title Co | |
| Parkinson Jade Lin | -- | Cache Title Company | |
| Nielson Amy | -- | Northern Title Company | |
| Lrc Properties Llc | -- | Premier Title Ins Agency | |
| Lasalle Bank National Association | $90,000 | Backman Title Services | |
| Reese Helen S | -- | Executive Title South Jordan |
Source: Public Records
Mortgage History
| Date | Status | Borrower | Loan Amount |
|---|---|---|---|
| Open | Morgan Eli | $271,600 | |
| Previous Owner | Rasmussen Tyler C | $167,902 | |
| Previous Owner | Parkinson Jade Lin | $106,534 | |
| Previous Owner | Nielson Amy | $89,200 | |
| Previous Owner | Reese Helen S | $112,000 |
Source: Public Records
Tax History Compared to Growth
Tax History
| Year | Tax Paid | Tax Assessment Tax Assessment Total Assessment is a certain percentage of the fair market value that is determined by local assessors to be the total taxable value of land and additions on the property. | Land | Improvement |
|---|---|---|---|---|
| 2024 | $1,424 | $178,355 | $0 | $0 |
| 2023 | $1,567 | $187,070 | $0 | $0 |
| 2022 | $1,514 | $168,750 | $0 | $0 |
| 2021 | $1,335 | $229,996 | $37,950 | $192,046 |
| 2020 | $1,198 | $185,678 | $37,950 | $147,728 |
| 2019 | $1,252 | $185,678 | $37,950 | $147,728 |
| 2018 | $1,254 | $169,850 | $37,950 | $131,900 |
| 2017 | $849 | $60,805 | $0 | $0 |
| 2016 | $880 | $60,805 | $0 | $0 |
| 2015 | $881 | $60,805 | $0 | $0 |
| 2014 | $797 | $60,805 | $0 | $0 |
| 2013 | -- | $60,805 | $0 | $0 |
Source: Public Records
Map
Nearby Homes