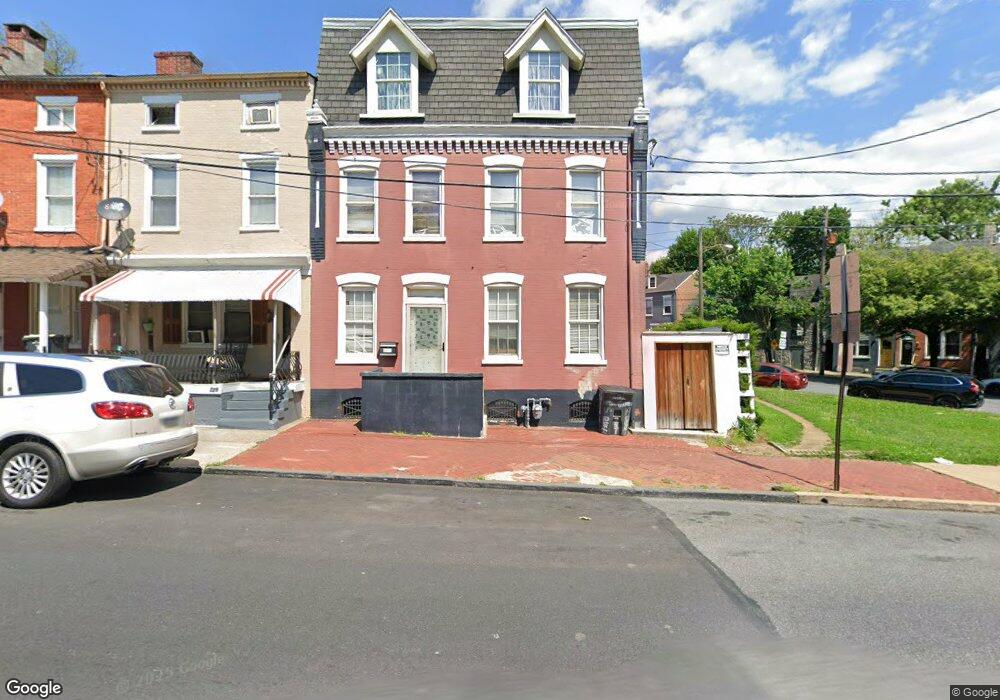
231 S Queen St Lancaster, PA 17603
Mussertown NeighborhoodEstimated Value: $318,000 - $378,389
4
Beds
3
Baths
2,698
Sq Ft
$128/Sq Ft
Est. Value
About This Home
This home is located at 231 S Queen St, Lancaster, PA 17603 and is currently estimated at $345,347, approximately $128 per square foot. 231 S Queen St is a home located in Lancaster County with nearby schools including Carter & MacRae Elementary School, Reynolds Middle School, and McCaskey High School.
Ownership History
Date
Name
Owned For
Owner Type
Purchase Details
Closed on
Oct 14, 2024
Sold by
Kwitch Jacques T
Bought by
Kwitch Jacques T
Current Estimated Value
Purchase Details
Closed on
Sep 1, 2010
Sold by
Secretary Of Housing & Urban Development
Bought by
Kwitch Jacques T
Home Financials for this Owner
Home Financials are based on the most recent Mortgage that was taken out on this home.
Original Mortgage
$25,000
Interest Rate
4.51%
Mortgage Type
Credit Line Revolving
Purchase Details
Closed on
Sep 30, 2009
Sold by
Mcclendon Robert C
Bought by
Midfirst Bank
Purchase Details
Closed on
May 14, 2009
Sold by
Midfirst Bank
Bought by
The Secretary Of Housing & Urban Develop
Create a Home Valuation Report for This Property
The Home Valuation Report is an in-depth analysis detailing your home's value as well as a comparison with similar homes in the area
Home Values in the Area
Average Home Value in this Area
Purchase History
| Date | Buyer | Sale Price | Title Company |
|---|---|---|---|
| Kwitch Jacques T | -- | None Listed On Document | |
| Kwitch Jacques T | $27,511 | None Available | |
| Midfirst Bank | $4,185 | None Available | |
| The Secretary Of Housing & Urban Develop | -- | None Available |
Source: Public Records
Mortgage History
| Date | Status | Borrower | Loan Amount |
|---|---|---|---|
| Previous Owner | Kwitch Jacques T | $25,000 |
Source: Public Records
Tax History Compared to Growth
Tax History
| Year | Tax Paid | Tax Assessment Tax Assessment Total Assessment is a certain percentage of the fair market value that is determined by local assessors to be the total taxable value of land and additions on the property. | Land | Improvement |
|---|---|---|---|---|
| 2025 | $3,937 | $99,500 | $14,500 | $85,000 |
| 2024 | $3,937 | $99,500 | $14,500 | $85,000 |
| 2023 | $3,871 | $99,500 | $14,500 | $85,000 |
| 2022 | $3,710 | $99,500 | $14,500 | $85,000 |
| 2021 | $3,630 | $99,500 | $14,500 | $85,000 |
| 2020 | $5,422 | $148,600 | $14,500 | $134,100 |
| 2019 | $5,154 | $143,400 | $14,500 | $128,900 |
| 2018 | $3,058 | $143,400 | $14,500 | $128,900 |
| 2017 | $2,829 | $61,600 | $8,200 | $53,400 |
| 2016 | $2,804 | $61,600 | $8,200 | $53,400 |
| 2015 | $1,094 | $61,600 | $8,200 | $53,400 |
| 2014 | $2,447 | $61,600 | $8,200 | $53,400 |
Source: Public Records
Map
Nearby Homes
- 316 Beaver St
- 14 E Farnum St
- 513 Howard Ave
- 341 S Prince St
- 507 Locust St
- 346 S Prince St
- 348 S Prince St
- 462 S Christian St
- 114 S Prince St
- 442 Fremont St
- 459 S Queen St
- 14 S Queen St
- 215 W Vine St
- 217 W Vine St
- 520 S Duke St
- 458 Poplar St
- 506 Beaver St
- 536 Woodward St
- 429 Hillside Ave
- 555 Woodward St