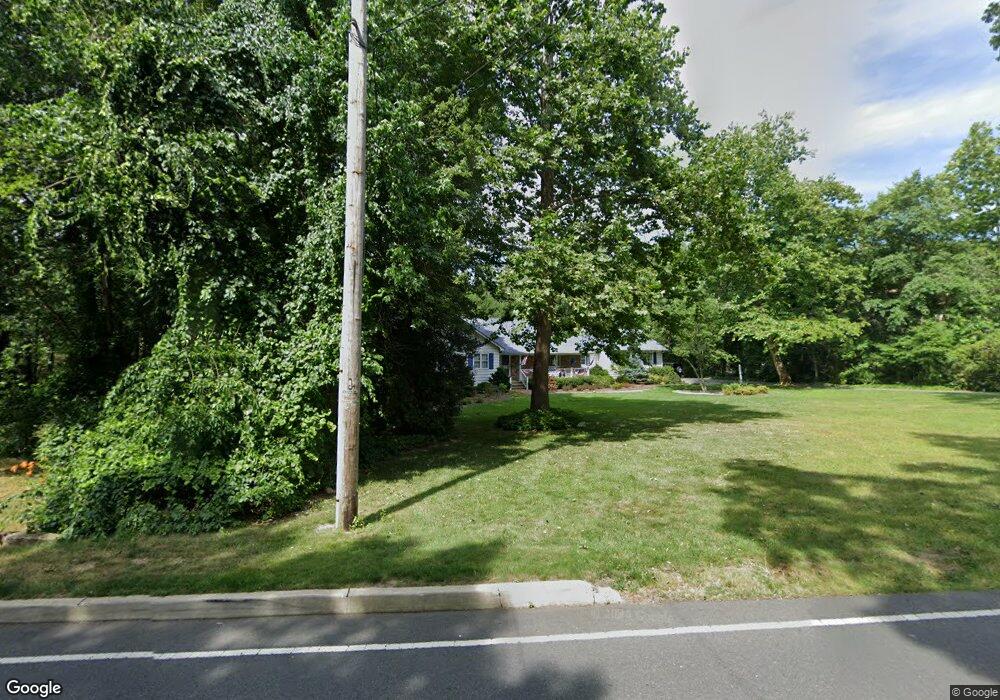
231 Ticetown Rd Old Bridge, NJ 08857
Estimated Value: $780,000 - $843,000
3
Beds
3
Baths
2,400
Sq Ft
$340/Sq Ft
Est. Value
About This Home
This home is located at 231 Ticetown Rd, Old Bridge, NJ 08857 and is currently estimated at $815,133, approximately $339 per square foot. 231 Ticetown Rd is a home located in Middlesex County with nearby schools including Old Bridge High School, St. Ambrose School, and Calvary Christian School.
Ownership History
Date
Name
Owned For
Owner Type
Purchase Details
Closed on
Dec 31, 2010
Bought by
Scheier Stephanie and Scheier Kuncewitch,J P
Current Estimated Value
Create a Home Valuation Report for This Property
The Home Valuation Report is an in-depth analysis detailing your home's value as well as a comparison with similar homes in the area
Home Values in the Area
Average Home Value in this Area
Purchase History
| Date | Buyer | Sale Price | Title Company |
|---|---|---|---|
| Scheier Stephanie | $390,000 | -- |
Source: Public Records
Tax History
| Year | Tax Paid | Tax Assessment Tax Assessment Total Assessment is a certain percentage of the fair market value that is determined by local assessors to be the total taxable value of land and additions on the property. | Land | Improvement |
|---|---|---|---|---|
| 2025 | $13,031 | $226,700 | $64,400 | $162,300 |
| 2024 | $12,518 | $226,700 | $64,400 | $162,300 |
| 2023 | $12,518 | $226,700 | $64,400 | $162,300 |
| 2022 | $12,131 | $226,700 | $64,400 | $162,300 |
| 2021 | $8,912 | $226,700 | $64,400 | $162,300 |
| 2020 | $11,786 | $226,700 | $64,400 | $162,300 |
| 2019 | $11,605 | $226,700 | $64,400 | $162,300 |
| 2018 | $11,464 | $226,700 | $64,400 | $162,300 |
| 2017 | $11,113 | $226,700 | $64,400 | $162,300 |
| 2016 | $10,886 | $226,700 | $64,400 | $162,300 |
| 2015 | $10,703 | $226,700 | $64,400 | $162,300 |
| 2014 | $10,591 | $226,700 | $64,400 | $162,300 |
Source: Public Records
Map
Nearby Homes
Your Personal Tour Guide
Ask me questions while you tour the home.