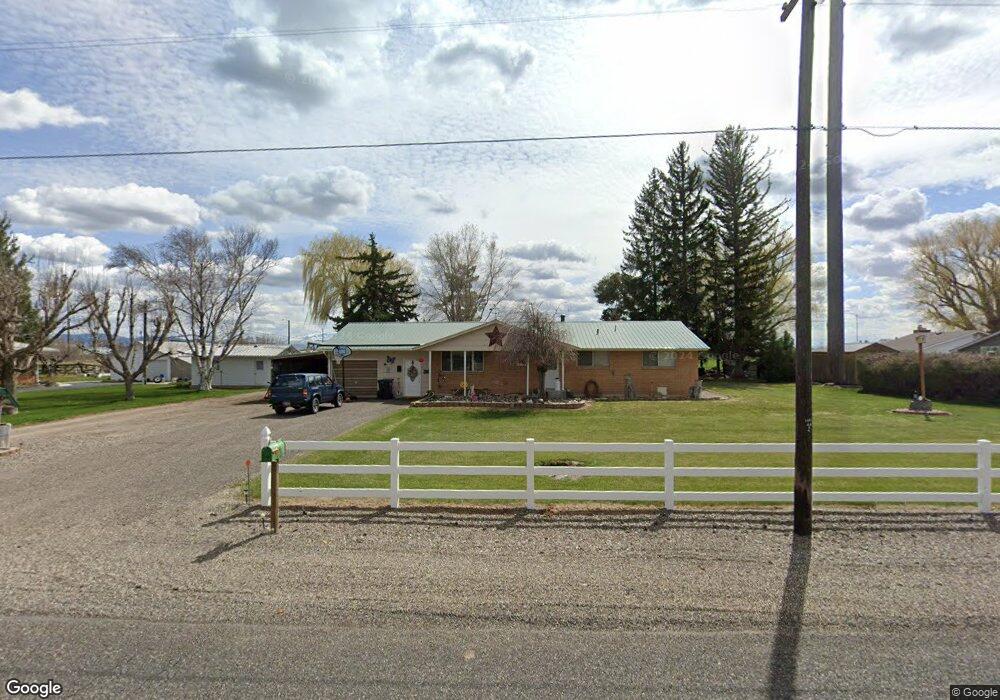
231 W 200 S Rupert, ID 83350
Estimated Value: $290,000 - $366,000
3
Beds
3
Baths
1,400
Sq Ft
$244/Sq Ft
Est. Value
About This Home
This home is located at 231 W 200 S, Rupert, ID 83350 and is currently estimated at $341,474, approximately $243 per square foot. 231 W 200 S is a home located in Minidoka County with nearby schools including Paul Elementary School, Minico Senior High School, and Artec Charter School.
Ownership History
Date
Name
Owned For
Owner Type
Purchase Details
Closed on
Jun 26, 2012
Sold by
Crist Terry T and Crist Terry
Bought by
Crist Terry
Current Estimated Value
Home Financials for this Owner
Home Financials are based on the most recent Mortgage that was taken out on this home.
Original Mortgage
$44,300
Interest Rate
3.77%
Mortgage Type
New Conventional
Purchase Details
Closed on
Jun 11, 2012
Sold by
Crist Terry T and Crist Terry
Bought by
Crist Terry
Home Financials for this Owner
Home Financials are based on the most recent Mortgage that was taken out on this home.
Original Mortgage
$44,300
Interest Rate
3.77%
Mortgage Type
New Conventional
Purchase Details
Closed on
Mar 22, 2012
Sold by
Crist Rhonda L
Bought by
Crist Terry T
Home Financials for this Owner
Home Financials are based on the most recent Mortgage that was taken out on this home.
Original Mortgage
$44,300
Interest Rate
3.79%
Mortgage Type
New Conventional
Create a Home Valuation Report for This Property
The Home Valuation Report is an in-depth analysis detailing your home's value as well as a comparison with similar homes in the area
Home Values in the Area
Average Home Value in this Area
Purchase History
| Date | Buyer | Sale Price | Title Company |
|---|---|---|---|
| Crist Terry | -- | Rupert Land Title | |
| Crist Terry | -- | Rupert Land Title | |
| Crist Terry T | -- | Rupert Land Title | |
| Crist Terry T | -- | Rupert Land Title |
Source: Public Records
Mortgage History
| Date | Status | Borrower | Loan Amount |
|---|---|---|---|
| Closed | Crist Terry | $44,300 | |
| Closed | Crist Terry T | $44,300 |
Source: Public Records
Tax History Compared to Growth
Tax History
| Year | Tax Paid | Tax Assessment Tax Assessment Total Assessment is a certain percentage of the fair market value that is determined by local assessors to be the total taxable value of land and additions on the property. | Land | Improvement |
|---|---|---|---|---|
| 2024 | $1,406 | $382,642 | $112,532 | $270,110 |
| 2023 | $1,190 | $366,702 | $112,532 | $254,170 |
| 2022 | $1,245 | $306,317 | $79,567 | $226,750 |
| 2021 | $1,083 | $236,243 | $62,163 | $174,080 |
| 2020 | $1,047 | $217,520 | $57,960 | $159,560 |
| 2019 | $982 | $191,796 | $0 | $0 |
| 2018 | $855 | $161,055 | $41,565 | $119,490 |
| 2017 | $839 | $162,262 | $33,292 | $128,970 |
| 2016 | $806 | $70,137 | $0 | $0 |
| 2015 | -- | $0 | $0 | $0 |
| 2014 | -- | $0 | $0 | $0 |
| 2012 | -- | $0 | $0 | $0 |
Source: Public Records
Map
Nearby Homes