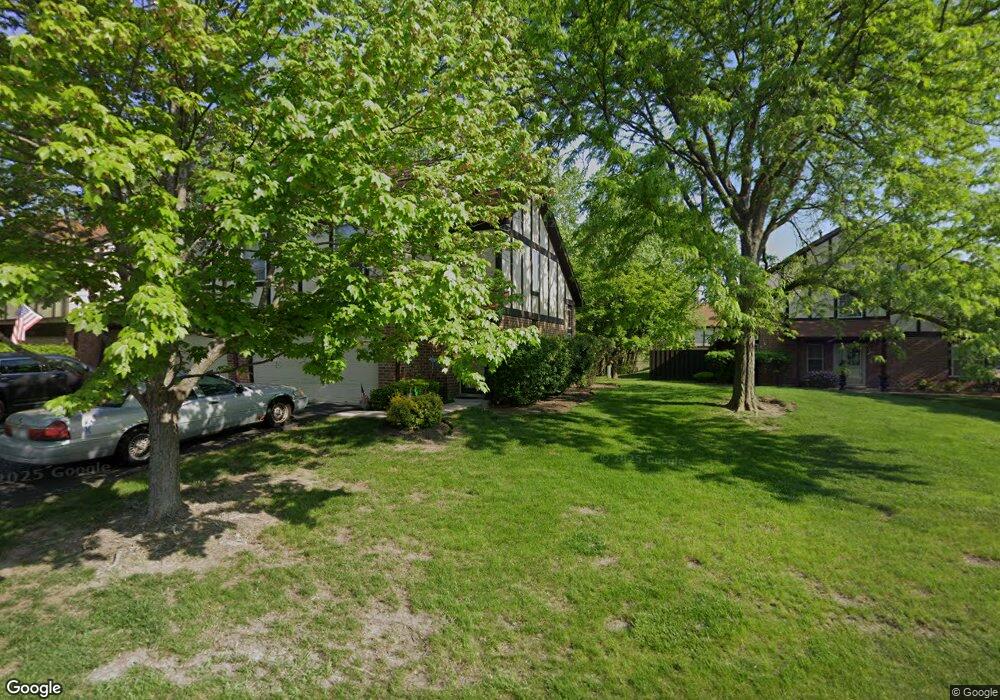
231 Willow Bridge Way Bloomingdale, IL 60108
Estimated Value: $281,000 - $345,000
2
Beds
2
Baths
1,250
Sq Ft
$251/Sq Ft
Est. Value
About This Home
This home is located at 231 Willow Bridge Way, Bloomingdale, IL 60108 and is currently estimated at $314,054, approximately $251 per square foot. 231 Willow Bridge Way is a home located in DuPage County with nearby schools including Marquardt Middle School, Glenbard East High School, and St Matthew School.
Ownership History
Date
Name
Owned For
Owner Type
Purchase Details
Closed on
Nov 2, 2024
Sold by
Cap Richard T
Bought by
Richard T Cap Revocable Trust and Cap
Current Estimated Value
Purchase Details
Closed on
Jun 8, 1998
Sold by
Bandur Zdzislaw and Bandur Ewa
Bought by
Cap Richard T
Home Financials for this Owner
Home Financials are based on the most recent Mortgage that was taken out on this home.
Original Mortgage
$69,000
Interest Rate
8%
Purchase Details
Closed on
Oct 15, 1994
Sold by
Cotton Gerald D
Bought by
Bandur Zdzislaw and Bandur Ewa
Home Financials for this Owner
Home Financials are based on the most recent Mortgage that was taken out on this home.
Original Mortgage
$121,000
Interest Rate
7.25%
Purchase Details
Closed on
Apr 11, 1994
Sold by
Lasalle National Trust
Bought by
Cotton Gerald D
Home Financials for this Owner
Home Financials are based on the most recent Mortgage that was taken out on this home.
Original Mortgage
$113,000
Interest Rate
7.66%
Create a Home Valuation Report for This Property
The Home Valuation Report is an in-depth analysis detailing your home's value as well as a comparison with similar homes in the area
Home Values in the Area
Average Home Value in this Area
Purchase History
| Date | Buyer | Sale Price | Title Company |
|---|---|---|---|
| Richard T Cap Revocable Trust | -- | None Listed On Document | |
| Cap Richard T | $138,500 | -- | |
| Bandur Zdzislaw | $134,500 | 1St American Title | |
| Cotton Gerald D | $142,000 | Intercounty Title Company |
Source: Public Records
Mortgage History
| Date | Status | Borrower | Loan Amount |
|---|---|---|---|
| Previous Owner | Cap Richard T | $69,000 | |
| Previous Owner | Bandur Zdzislaw | $121,000 | |
| Previous Owner | Cotton Gerald D | $113,000 |
Source: Public Records
Tax History Compared to Growth
Tax History
| Year | Tax Paid | Tax Assessment Tax Assessment Total Assessment is a certain percentage of the fair market value that is determined by local assessors to be the total taxable value of land and additions on the property. | Land | Improvement |
|---|---|---|---|---|
| 2024 | $6,385 | $79,136 | $18,086 | $61,050 |
| 2023 | $5,955 | $72,370 | $16,540 | $55,830 |
| 2022 | $5,896 | $66,790 | $16,430 | $50,360 |
| 2021 | $5,765 | $63,460 | $15,610 | $47,850 |
| 2020 | $5,441 | $61,910 | $15,230 | $46,680 |
| 2019 | $5,557 | $63,050 | $15,410 | $47,640 |
| 2018 | $5,801 | $61,420 | $15,010 | $46,410 |
| 2017 | $5,489 | $56,930 | $13,910 | $43,020 |
| 2016 | $5,191 | $52,680 | $12,870 | $39,810 |
| 2015 | $5,069 | $49,160 | $12,010 | $37,150 |
| 2014 | $4,956 | $47,800 | $11,680 | $36,120 |
| 2013 | $5,019 | $49,440 | $12,080 | $37,360 |
Source: Public Records
Map
Nearby Homes
- 316 Juliana Ln
- 358 Mayo Ln
- 310 Terry Ln
- 316 Morningside Dr Unit A
- 300 Starling Ct Unit A
- 213 Dartmouth Ct Unit D
- 205 Emerson Ct Unit B
- 881 N Swift Rd Unit 106
- 865 N Tamarac Blvd
- 319 Indiana Ct Unit D
- 802 N Tamarac Blvd Unit Z5
- 158 S Prairie Ave
- 2155 College Dr Unit 7
- 2158 College Dr Unit 7
- 259 Cunningham Ln
- 953 N Rohlwing Rd Unit GB
- 953 N Rohlwing Rd Unit 201A
- 264 Winston Ln
- 120 Lakeview Dr Unit 513
- 120 Lakeview Dr Unit 318
- 232 Willow Bridge Way Unit 9
- 233 Willow Bridge Way
- 234 Willow Bridge Way Unit 9
- 235 Willow Bridge Way
- 340 Arquilla Ct
- 236 Willow Bridge Way
- 21 Willow Bridge Way Unit 211
- 18 Willow Bridge Way Unit 3
- 18 Willow Bridge Way
- 18 Willow Bridge Way Unit 4
- 18 Willow Bridge Way Unit 2
- 18 Willow Bridge Way Unit 1
- 18 Willow Bridge Way Unit 18-4
- 18 Willow Bridge Way Unit 18-1
- 22 Willow Bridge Way
- 342 Arquilla Ct Unit 5
- 24 Willow Bridge Way
- 24 Willow Bridge Way Unit 24
- 25 Willow Bridge Way
- 30 Willow Bridge Way