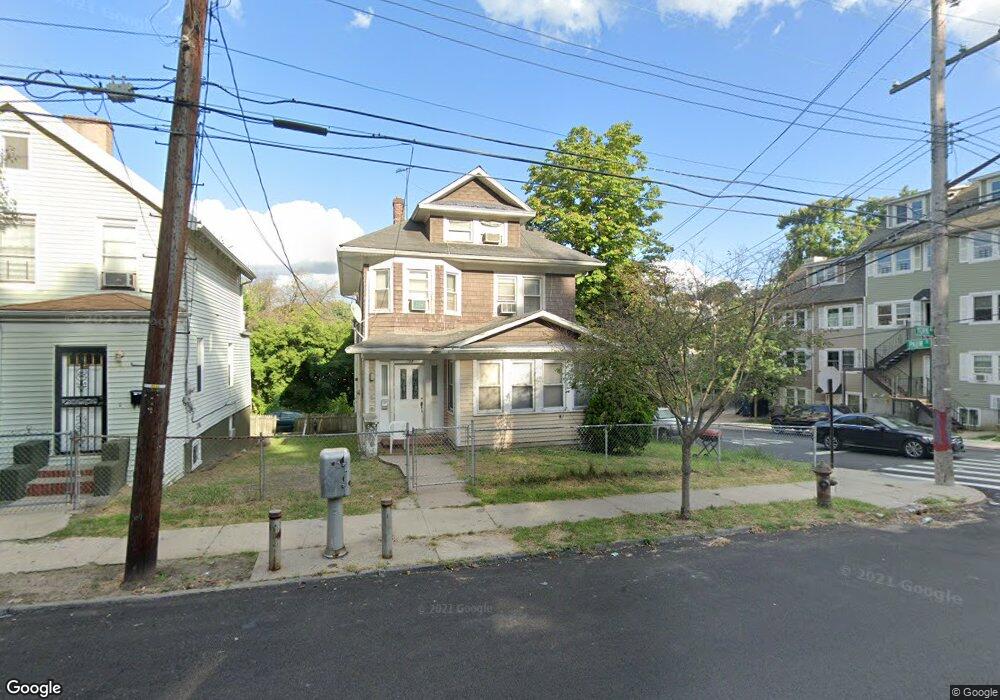
231 York Ave Staten Island, NY 10301
New Brighton NeighborhoodEstimated Value: $753,000 - $996,000
--
Bed
--
Bath
1,960
Sq Ft
$459/Sq Ft
Est. Value
About This Home
This home is located at 231 York Ave, Staten Island, NY 10301 and is currently estimated at $899,072, approximately $458 per square foot. 231 York Ave is a home located in Richmond County with nearby schools including P.S. 31 - William T. Davis, Is 61 William A Morris, and Curtis High School.
Ownership History
Date
Name
Owned For
Owner Type
Purchase Details
Closed on
Apr 24, 2006
Sold by
Batts Thomas
Bought by
Isaac Wendy
Current Estimated Value
Home Financials for this Owner
Home Financials are based on the most recent Mortgage that was taken out on this home.
Original Mortgage
$445,200
Outstanding Balance
$280,929
Interest Rate
8.12%
Mortgage Type
Fannie Mae Freddie Mac
Estimated Equity
$618,143
Purchase Details
Closed on
Oct 24, 1996
Sold by
Hurlston Leslie and Mcccy Floyd
Bought by
Batts Thomas
Home Financials for this Owner
Home Financials are based on the most recent Mortgage that was taken out on this home.
Original Mortgage
$201,000
Interest Rate
7.83%
Create a Home Valuation Report for This Property
The Home Valuation Report is an in-depth analysis detailing your home's value as well as a comparison with similar homes in the area
Home Values in the Area
Average Home Value in this Area
Purchase History
| Date | Buyer | Sale Price | Title Company |
|---|---|---|---|
| Isaac Wendy | $556,500 | First Amer Title Ins Co Ny | |
| Batts Thomas | $201,000 | -- |
Source: Public Records
Mortgage History
| Date | Status | Borrower | Loan Amount |
|---|---|---|---|
| Open | Isaac Wendy | $445,200 | |
| Previous Owner | Batts Thomas | $201,000 |
Source: Public Records
Tax History Compared to Growth
Tax History
| Year | Tax Paid | Tax Assessment Tax Assessment Total Assessment is a certain percentage of the fair market value that is determined by local assessors to be the total taxable value of land and additions on the property. | Land | Improvement |
|---|---|---|---|---|
| 2025 | $4,145 | $53,280 | $3,956 | $49,324 |
| 2024 | $2,480 | $49,740 | $4,008 | $45,732 |
| 2023 | $4,191 | $20,635 | $3,619 | $17,016 |
| 2022 | $4,076 | $44,820 | $9,660 | $35,160 |
| 2021 | $4,056 | $41,340 | $9,660 | $31,680 |
| 2020 | $9,738 | $40,860 | $9,660 | $31,200 |
| 2019 | $3,640 | $39,480 | $9,660 | $29,820 |
| 2018 | $3,505 | $17,196 | $4,473 | $12,723 |
| 2017 | $3,469 | $17,017 | $4,740 | $12,277 |
| 2016 | $3,210 | $16,059 | $5,985 | $10,074 |
| 2015 | $2,750 | $15,151 | $5,646 | $9,505 |
| 2014 | $2,750 | $14,330 | $4,541 | $9,789 |
Source: Public Records
Map
Nearby Homes