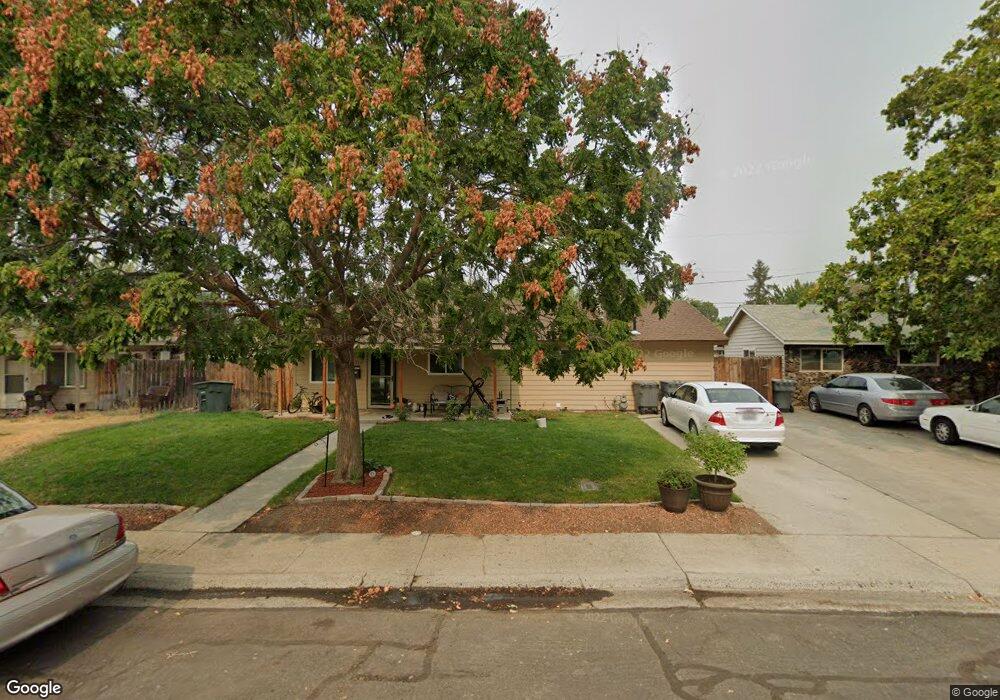
2310 Boulder St Richland, WA 99352
Estimated Value: $257,000 - $322,000
3
Beds
1
Bath
814
Sq Ft
$362/Sq Ft
Est. Value
About This Home
This home is located at 2310 Boulder St, Richland, WA 99352 and is currently estimated at $294,775, approximately $362 per square foot. 2310 Boulder St is a home located in Benton County with nearby schools including Marcus Whitman Elementary School, Carmichael Middle School, and Richland High School.
Ownership History
Date
Name
Owned For
Owner Type
Purchase Details
Closed on
Jun 2, 2016
Sold by
Rodriguez Hortencia G
Bought by
Rodriguez Ii Juan C
Current Estimated Value
Home Financials for this Owner
Home Financials are based on the most recent Mortgage that was taken out on this home.
Original Mortgage
$4,516
Outstanding Balance
$3,599
Interest Rate
3.61%
Mortgage Type
Unknown
Estimated Equity
$291,176
Purchase Details
Closed on
May 27, 2016
Sold by
Sanchez Olivia H
Bought by
Rodriguez Ii Juan C
Home Financials for this Owner
Home Financials are based on the most recent Mortgage that was taken out on this home.
Original Mortgage
$4,516
Outstanding Balance
$3,599
Interest Rate
3.61%
Mortgage Type
Unknown
Estimated Equity
$291,176
Purchase Details
Closed on
Jul 6, 2006
Sold by
Johnston Julie A
Bought by
Sanchez Olivia H
Home Financials for this Owner
Home Financials are based on the most recent Mortgage that was taken out on this home.
Original Mortgage
$97,850
Interest Rate
6.66%
Mortgage Type
Purchase Money Mortgage
Create a Home Valuation Report for This Property
The Home Valuation Report is an in-depth analysis detailing your home's value as well as a comparison with similar homes in the area
Home Values in the Area
Average Home Value in this Area
Purchase History
| Date | Buyer | Sale Price | Title Company |
|---|---|---|---|
| Rodriguez Ii Juan C | -- | Chicago Title | |
| Rodriguez Ii Juan C | $115,000 | Chicago Title | |
| Sanchez Olivia H | $97,850 | Chicago Title |
Source: Public Records
Mortgage History
| Date | Status | Borrower | Loan Amount |
|---|---|---|---|
| Open | Rodriguez Ii Juan C | $4,516 | |
| Open | Rodriguez Ii Juan C | $112,917 | |
| Previous Owner | Sanchez Olivia H | $97,850 |
Source: Public Records
Tax History Compared to Growth
Tax History
| Year | Tax Paid | Tax Assessment Tax Assessment Total Assessment is a certain percentage of the fair market value that is determined by local assessors to be the total taxable value of land and additions on the property. | Land | Improvement |
|---|---|---|---|---|
| 2024 | $1,915 | $216,530 | $50,000 | $166,530 |
| 2023 | $1,915 | $201,920 | $50,000 | $151,920 |
| 2022 | $1,798 | $172,700 | $50,000 | $122,700 |
| 2021 | $1,702 | $161,020 | $50,000 | $111,020 |
| 2020 | $1,815 | $146,410 | $50,000 | $96,410 |
| 2019 | $1,328 | $147,880 | $24,000 | $123,880 |
| 2018 | $1,297 | $116,030 | $24,000 | $92,030 |
| 2017 | $1,134 | $94,790 | $24,000 | $70,790 |
| 2016 | $1,118 | $94,790 | $24,000 | $70,790 |
| 2015 | $1,139 | $94,790 | $24,000 | $70,790 |
| 2014 | -- | $94,790 | $24,000 | $70,790 |
| 2013 | -- | $94,790 | $24,000 | $70,790 |
Source: Public Records
Map
Nearby Homes
- 2209 Boise St
- 2305 Concord St
- 302 Rossell Ave
- 2404 Dallas St
- 211 Wright Ave
- 1416 Agnes St
- 2402 Dover St
- 2109 Duportail St
- 2407 Duportail St
- 2120 Duportail St Unit 1
- 405 Basswood Ave
- 503 Wright Ave Unit B8
- 513 Winslow Ave
- 1088 Makah Ct
- 626 Snow Ave
- 2377 Maggio Loop
- 95 Ridgecliff Dr
- 771 Rio Vista Loop Unit Lot17
- 775 Rio Vista Loop Unit Lot18
- 779 Rio Vista Loop Unit Lot19
- 2308 Boulder St
- 2400 Boulder St
- 2209 Camden St
- 2301 Camden St
- 2207 Camden St
- 2306 Boulder St
- 2402 Boulder St
- 2303 Camden St
- 2205 Camden St
- 2311 Boulder St
- 2401 Boulder St
- 2309 Boulder St
- 2304 Boulder St
- 2305 Camden St
- 2404 Boulder St
- 2307 Boulder St
- 2403 Boulder St
- 2203 Camden St
- 2307 Camden St
- 2300 Boulder St