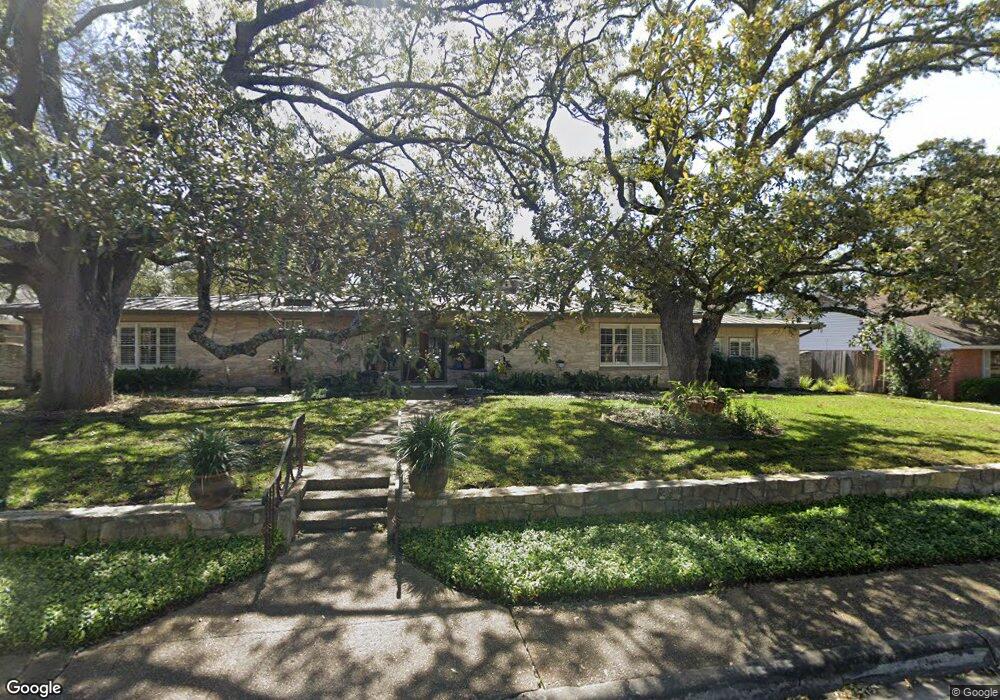
2310 Camelback Dr San Antonio, TX 78209
Terrell Heights NeighborhoodEstimated Value: $823,000 - $1,024,000
4
Beds
3
Baths
3,586
Sq Ft
$263/Sq Ft
Est. Value
About This Home
This home is located at 2310 Camelback Dr, San Antonio, TX 78209 and is currently estimated at $943,210, approximately $263 per square foot. 2310 Camelback Dr is a home located in Bexar County with nearby schools including Woodridge Elementary School, Alamo Heights Junior School, and Alamo Heights High School.
Ownership History
Date
Name
Owned For
Owner Type
Purchase Details
Closed on
Aug 16, 2018
Sold by
Walsh Doyle T
Bought by
Pixley Teresa A
Current Estimated Value
Purchase Details
Closed on
Aug 14, 1998
Sold by
Pixley Charles C
Bought by
Pixley Teresa A and Walsh Doyle T
Purchase Details
Closed on
May 8, 1997
Sold by
Weichert Relocation Co Inc
Bought by
Pixley Charles C and Pixley Teresa A
Home Financials for this Owner
Home Financials are based on the most recent Mortgage that was taken out on this home.
Original Mortgage
$90,000
Interest Rate
7.97%
Purchase Details
Closed on
Jan 31, 1995
Sold by
Shankle Perry and Shankle Alice Stratton
Bought by
Hernandez Michael T and Hernandez Flora M
Home Financials for this Owner
Home Financials are based on the most recent Mortgage that was taken out on this home.
Original Mortgage
$236,000
Interest Rate
8.37%
Create a Home Valuation Report for This Property
The Home Valuation Report is an in-depth analysis detailing your home's value as well as a comparison with similar homes in the area
Home Values in the Area
Average Home Value in this Area
Purchase History
| Date | Buyer | Sale Price | Title Company |
|---|---|---|---|
| Pixley Teresa A | -- | None Available | |
| Pixley Teresa A | -- | None Available | |
| Pixley Charles C | -- | -- | |
| Hernandez Michael T | -- | -- |
Source: Public Records
Mortgage History
| Date | Status | Borrower | Loan Amount |
|---|---|---|---|
| Previous Owner | Pixley Charles C | $90,000 | |
| Previous Owner | Hernandez Michael T | $236,000 |
Source: Public Records
Tax History Compared to Growth
Tax History
| Year | Tax Paid | Tax Assessment Tax Assessment Total Assessment is a certain percentage of the fair market value that is determined by local assessors to be the total taxable value of land and additions on the property. | Land | Improvement |
|---|---|---|---|---|
| 2025 | $12,339 | $855,690 | $349,180 | $506,510 |
| 2024 | $12,339 | $855,690 | $349,180 | $506,510 |
| 2023 | $12,339 | $780,450 | $349,180 | $506,510 |
| 2022 | $17,176 | $709,500 | $241,100 | $515,310 |
| 2021 | $16,097 | $645,000 | $209,710 | $435,290 |
| 2020 | $15,827 | $633,500 | $148,550 | $484,950 |
| 2019 | $15,836 | $619,000 | $148,550 | $470,450 |
| 2018 | $15,181 | $606,000 | $148,550 | $457,450 |
| 2017 | $15,179 | $606,000 | $148,550 | $457,450 |
| 2016 | $15,931 | $636,000 | $122,760 | $513,240 |
| 2015 | $14,278 | $620,000 | $122,760 | $497,240 |
| 2014 | $14,278 | $572,000 | $0 | $0 |
Source: Public Records
Map
Nearby Homes
- 200 Ruelle Ln Unit 200A
- 7014 Scotsdale Dr
- 109 Ruelle Unit 109-A
- 106 Irvington Dr
- 112 Ruelle
- 534 Brightwood Place
- 66 Brees Blvd Unit 125
- 66 Brees Blvd Unit 42
- 102 Ruelle Unit 200-B
- 102 Ruelle Unit 106C
- 102 Ruelle Unit 220B
- 602 Brightwood Place
- 307 Greenwich Blvd
- 539 Brightwood Place
- 130 Larchmont Dr
- 131 Larchmont Dr
- 611 Brightwood Place
- 261 E Fair Oaks Place
- 135 Irvington Dr
- 124 Harmon Dr
- 2306 Camelback Dr
- 2314 Camelback Dr
- 2315 Woodmen Dr
- 2311 Woodmen Dr
- 2311 Camelback Dr
- 2319 Woodmen Dr
- 2307 Camelback Dr
- 2315 Camelback Dr
- 2318 Camelback Dr
- 2302 Camelback Dr
- 2307 Woodmen Dr
- 2323 Woodmen Dr
- 2303 Camelback Dr
- 2319 Camelback Dr
- 2303 Woodmen Dr
- 2218 Camelback Dr
- 2314 Briarwood Dr
- 2314 Woodmen Dr
- 2310 Briarwood Dr
- 2318 Woodmen Dr