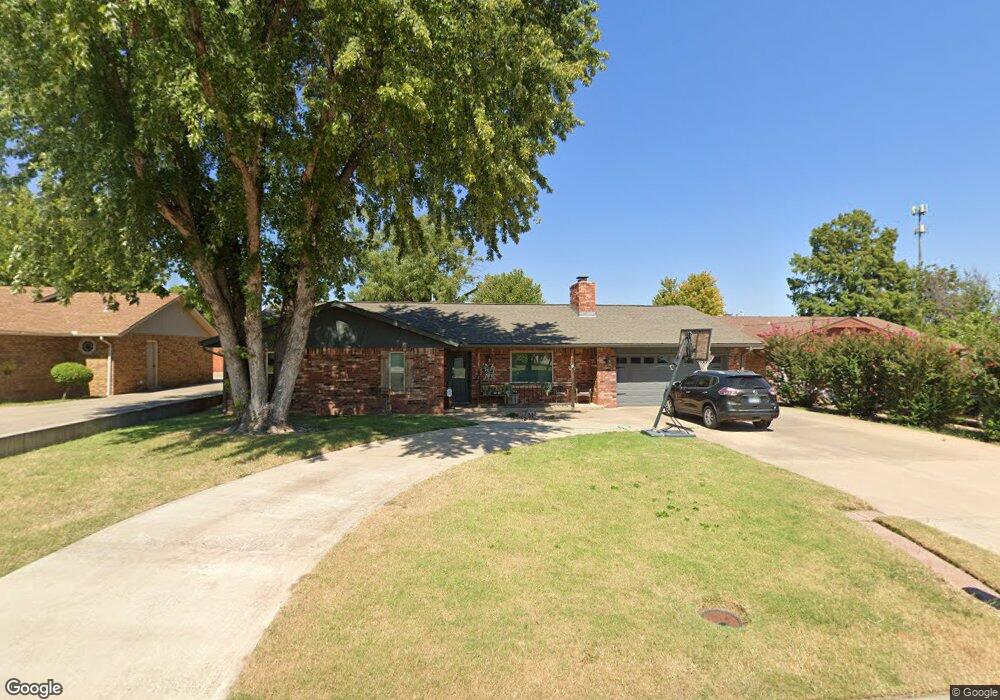
2310 Leaning Elm Rd Woodward, OK 73801
Estimated Value: $200,000 - $241,000
3
Beds
2
Baths
1,999
Sq Ft
$108/Sq Ft
Est. Value
About This Home
This home is located at 2310 Leaning Elm Rd, Woodward, OK 73801 and is currently estimated at $215,547, approximately $107 per square foot. 2310 Leaning Elm Rd is a home located in Woodward County with nearby schools including Woodward High School and Woodward Christian Academy.
Ownership History
Date
Name
Owned For
Owner Type
Purchase Details
Closed on
Oct 31, 2008
Sold by
Pratt Family Trust
Bought by
Langdon Lee Michael and Langdon Aime Mlynn
Current Estimated Value
Home Financials for this Owner
Home Financials are based on the most recent Mortgage that was taken out on this home.
Original Mortgage
$135,000
Outstanding Balance
$87,515
Interest Rate
5.83%
Mortgage Type
New Conventional
Estimated Equity
$128,032
Purchase Details
Closed on
Jun 26, 2006
Sold by
Arrowhead Homes Llc
Bought by
Pratt Arnold and Pratt Barbara
Purchase Details
Closed on
Apr 24, 2006
Sold by
Norwood William S and Norwood Debra K
Bought by
Arrowhead Homes Llc
Purchase Details
Closed on
Dec 8, 1995
Bought by
Norwood William and Norwood Debra
Purchase Details
Closed on
Nov 4, 1994
Bought by
Brace Brace M and Brace L
Purchase Details
Closed on
Apr 20, 1994
Bought by
Varner David A
Create a Home Valuation Report for This Property
The Home Valuation Report is an in-depth analysis detailing your home's value as well as a comparison with similar homes in the area
Home Values in the Area
Average Home Value in this Area
Purchase History
| Date | Buyer | Sale Price | Title Company |
|---|---|---|---|
| Langdon Lee Michael | $160,000 | -- | |
| Pratt Arnold | -- | -- | |
| Arrowhead Homes Llc | $140,000 | -- | |
| Norwood William | $92,000 | -- | |
| Brace Brace M | $85,500 | -- | |
| Varner David A | $85,500 | -- |
Source: Public Records
Mortgage History
| Date | Status | Borrower | Loan Amount |
|---|---|---|---|
| Open | Langdon Lee Michael | $135,000 |
Source: Public Records
Tax History Compared to Growth
Tax History
| Year | Tax Paid | Tax Assessment Tax Assessment Total Assessment is a certain percentage of the fair market value that is determined by local assessors to be the total taxable value of land and additions on the property. | Land | Improvement |
|---|---|---|---|---|
| 2023 | $1,736 | $19,026 | $2,116 | $16,910 |
| 2022 | $1,695 | $18,252 | $2,116 | $16,136 |
| 2021 | $1,575 | $17,424 | $2,116 | $15,308 |
| 2020 | $1,587 | $17,424 | $2,116 | $15,308 |
| 2019 | $1,693 | $18,958 | $2,116 | $16,842 |
| 2018 | $1,693 | $18,655 | $2,116 | $16,539 |
| 2017 | $1,594 | $17,767 | $2,116 | $15,651 |
| 2016 | $1,601 | $17,600 | $1,213 | $16,387 |
| 2015 | $1,539 | $17,600 | $1,213 | $16,387 |
| 2014 | $1,573 | $17,992 | $1,273 | $16,719 |
Source: Public Records
Map
Nearby Homes
- 2238 Red Cedar
- 2322 Camden Way
- 2211 Briarwood Dr
- 2816 Wilshire St
- 2418 Wildwood Dr
- 2928 Edgewood Dr
- 3614 22nd St
- 2832 Brook Haven Rd
- 11 Brookhaven
- 3008 Brook Haven Rd
- 12 Brookhaven
- 13 Brookhaven
- 2805 Moeliing Ln Unit 2815 Moelling Lane
- SEC E
- SEC 32-23-21 Tract C
- SEC 32-23-21 Tract B
- Sec
- 1907 19th St
- 1919 18th St
- 1841 19th St
- 2318 Leaning Elm Rd
- 2304 Leaning Elm Rd
- 2317 Pinewood Dr
- 2324 Leaning Elm Rd
- 2323 Pinewood Dr
- 2309 Pinewood Dr
- 2802 Blue Sage Dr
- 2313 Leaning Elm Rd
- 2401 Pinewood Dr
- 2806 Blue Sage Dr
- 2317 Leaning Elm Rd
- 2401 Sherwood Ct
- 2404 Leaning Elm Rd
- 2237 Red Cedar
- 2233 Red Cedar
- 2812 Blue Sage Dr
- 2323 Leaning Elm Rd
- 2407 Sherwood Ct
- 2410 Leaning Elm Rd
- 2316 Pinewood Dr