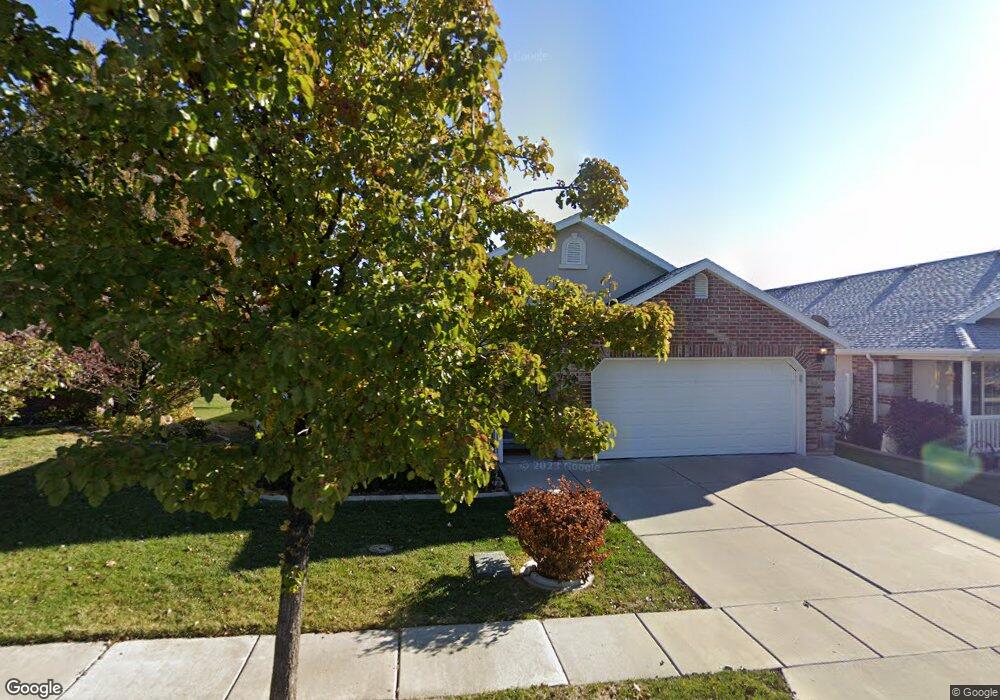
2310 N 1085 W Unit 39 Layton, UT 84041
Estimated Value: $438,000 - $509,000
3
Beds
2
Baths
1,988
Sq Ft
$237/Sq Ft
Est. Value
About This Home
This home is located at 2310 N 1085 W Unit 39, Layton, UT 84041 and is currently estimated at $472,033, approximately $237 per square foot. 2310 N 1085 W Unit 39 is a home located in Davis County with nearby schools including Lincoln Elementary School, North Layton Junior High School, and Northridge High School.
Ownership History
Date
Name
Owned For
Owner Type
Purchase Details
Closed on
Mar 7, 2013
Sold by
Hunt Richard M
Bought by
Mayhew Steven Kent and Mayhew Barbara J
Current Estimated Value
Home Financials for this Owner
Home Financials are based on the most recent Mortgage that was taken out on this home.
Original Mortgage
$80,000
Outstanding Balance
$15,659
Interest Rate
2.68%
Mortgage Type
New Conventional
Estimated Equity
$456,374
Purchase Details
Closed on
Sep 7, 2006
Sold by
Hunt Richard M
Bought by
Hunt Richard M and Richard M Hunt Family Trust
Purchase Details
Closed on
Jun 5, 2006
Sold by
Greater Utah Land Investment Llc
Bought by
Colonial Builders Group Llc
Home Financials for this Owner
Home Financials are based on the most recent Mortgage that was taken out on this home.
Original Mortgage
$148,345
Interest Rate
6.52%
Mortgage Type
Construction
Create a Home Valuation Report for This Property
The Home Valuation Report is an in-depth analysis detailing your home's value as well as a comparison with similar homes in the area
Home Values in the Area
Average Home Value in this Area
Purchase History
| Date | Buyer | Sale Price | Title Company |
|---|---|---|---|
| Mayhew Steven Kent | -- | Security Title Of Dav | |
| Hunt Richard M | -- | First American Title | |
| Hunt Richard M | -- | Lincoln Title Ins Agency | |
| Colonial Builders Group Llc | -- | Lincoln Title Insurance |
Source: Public Records
Mortgage History
| Date | Status | Borrower | Loan Amount |
|---|---|---|---|
| Open | Mayhew Steven Kent | $80,000 | |
| Previous Owner | Colonial Builders Group Llc | $148,345 |
Source: Public Records
Tax History Compared to Growth
Tax History
| Year | Tax Paid | Tax Assessment Tax Assessment Total Assessment is a certain percentage of the fair market value that is determined by local assessors to be the total taxable value of land and additions on the property. | Land | Improvement |
|---|---|---|---|---|
| 2024 | $167 | $233,750 | $52,250 | $181,500 |
| 2023 | $2,259 | $421,000 | $91,000 | $330,000 |
| 2022 | $2,364 | $239,250 | $45,650 | $193,600 |
| 2021 | $389 | $306,000 | $69,000 | $237,000 |
| 2020 | $1,823 | $264,000 | $51,000 | $213,000 |
| 2019 | $1,784 | $253,000 | $49,000 | $204,000 |
| 2018 | $1,636 | $233,000 | $49,000 | $184,000 |
| 2016 | $278 | $108,570 | $26,950 | $81,620 |
| 2015 | $1,460 | $101,805 | $26,950 | $74,855 |
| 2014 | $1,538 | $109,681 | $18,333 | $91,348 |
| 2013 | -- | $107,250 | $42,911 | $64,339 |
Source: Public Records
Map
Nearby Homes
- 781 W 2150 N
- 2402 N 725 W
- 2378 N 675 W
- 2211 N 525 W
- 2887 N 1175 W
- 2187 N 450 W
- 2949 N 1175 W
- 1606 W 1960 N
- 850 S 1650 E Unit D
- 1548 E 925 S
- 1094 N Angel St W
- 1665 W 1960 N
- 1413 W 1650 N
- 709 W Highway 193
- 2875 N Hill Field Rd Unit 58
- 2875 N Hill Field Rd Unit 17
- 2875 N Hill Field Rd Unit 62
- 1615 N Angel St Unit E
- 1615 N Angel St Unit H
- 1615 N Angel St Unit I
- 2298 N 1085 W Unit 40
- 2320 N 1085 W
- 1051 Hidden Dr Unit 31
- 2284 N 1085 W Unit 41
- 2326 N 1085 W
- 1089 W 2325 N Unit 30
- 2333 Garden Ln Unit 32
- 2327 Garden Ln Unit 33
- 2278 N 1085 W Unit 42
- 2287 N 1085 W Unit 52
- 2287 N 1085 W
- 1035 Hidden Dr Unit 30
- 1035 Hidden Dr
- 1086 W 2325 N Unit 31
- 1086 W 2325 N
- 1105 W 2325 N
- 2281 N 1085 W Unit 50
- 1094 W 2325 N
- 2315 Garden Ln Unit 34
- 2315 Garden Ln