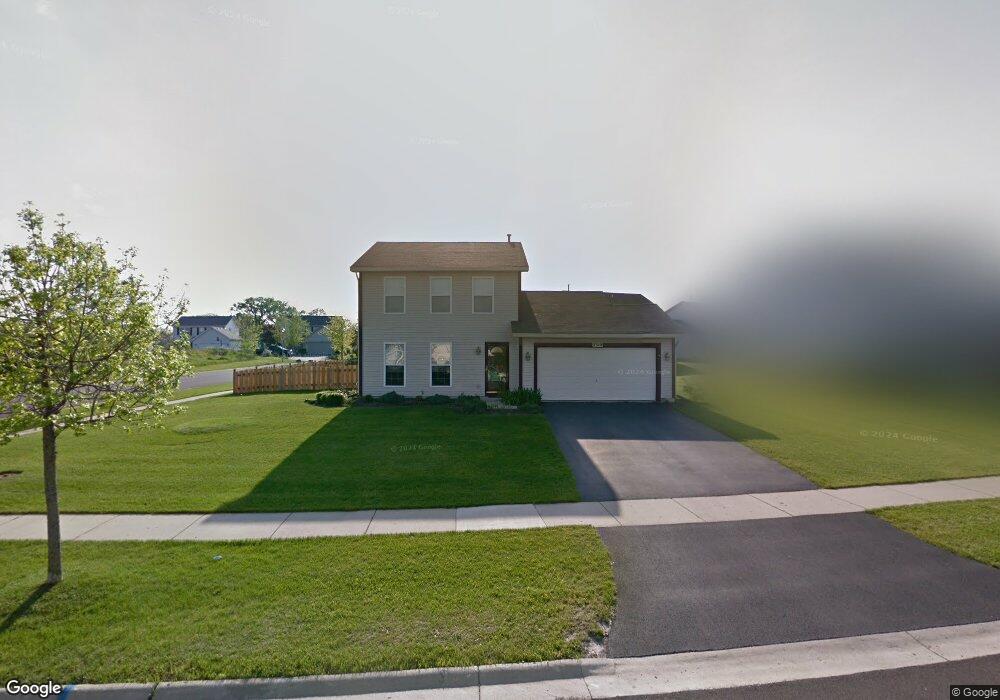
2310 N Fox Chase Dr Round Lake Beach, IL 60073
Estimated Value: $324,000 - $340,000
3
Beds
3
Baths
1,546
Sq Ft
$216/Sq Ft
Est. Value
About This Home
This home is located at 2310 N Fox Chase Dr, Round Lake Beach, IL 60073 and is currently estimated at $333,680, approximately $215 per square foot. 2310 N Fox Chase Dr is a home located in Lake County with nearby schools including Avon Center Elementary School, Frederick School, and Grayslake Middle School.
Ownership History
Date
Name
Owned For
Owner Type
Purchase Details
Closed on
Aug 6, 2014
Sold by
Waugh Debra M and Hilty Timothy B
Bought by
Hilty Timothy B
Current Estimated Value
Home Financials for this Owner
Home Financials are based on the most recent Mortgage that was taken out on this home.
Original Mortgage
$162,000
Outstanding Balance
$89,213
Interest Rate
4.25%
Mortgage Type
VA
Estimated Equity
$244,467
Purchase Details
Closed on
Jul 14, 2009
Sold by
Hilty Timothy B and Hilty Debra K
Bought by
Hilty Timothy B
Purchase Details
Closed on
Apr 24, 2001
Sold by
Lakewood Hills Llc
Bought by
Hilty Timothy B and Hilty Debra K
Home Financials for this Owner
Home Financials are based on the most recent Mortgage that was taken out on this home.
Original Mortgage
$161,150
Interest Rate
6.95%
Mortgage Type
VA
Create a Home Valuation Report for This Property
The Home Valuation Report is an in-depth analysis detailing your home's value as well as a comparison with similar homes in the area
Home Values in the Area
Average Home Value in this Area
Purchase History
| Date | Buyer | Sale Price | Title Company |
|---|---|---|---|
| Hilty Timothy B | -- | Advantage Title Company Llc | |
| Hilty Timothy B | -- | None Available | |
| Hilty Timothy B | $161,500 | -- |
Source: Public Records
Mortgage History
| Date | Status | Borrower | Loan Amount |
|---|---|---|---|
| Open | Hilty Timothy B | $162,000 | |
| Closed | Hilty Timothy B | $161,150 |
Source: Public Records
Tax History Compared to Growth
Tax History
| Year | Tax Paid | Tax Assessment Tax Assessment Total Assessment is a certain percentage of the fair market value that is determined by local assessors to be the total taxable value of land and additions on the property. | Land | Improvement |
|---|---|---|---|---|
| 2024 | $8,163 | $83,086 | $15,562 | $67,524 |
| 2023 | $7,416 | $73,411 | $13,750 | $59,661 |
| 2022 | $7,416 | $64,095 | $11,472 | $52,623 |
| 2021 | $7,104 | $59,540 | $10,657 | $48,883 |
| 2020 | $7,229 | $57,633 | $10,316 | $47,317 |
| 2019 | $7,000 | $55,389 | $9,914 | $45,475 |
| 2018 | $7,152 | $55,197 | $13,877 | $41,320 |
| 2017 | $7,197 | $53,725 | $13,507 | $40,218 |
| 2016 | $7,148 | $51,550 | $12,960 | $38,590 |
| 2015 | $7,097 | $48,146 | $12,104 | $36,042 |
| 2014 | $6,787 | $47,995 | $11,486 | $36,509 |
| 2012 | $6,229 | $48,226 | $11,541 | $36,685 |
Source: Public Records
Map
Nearby Homes
- 278 Crozier Dr
- 250 Crozier Dr
- 1290 E Fox Chase Dr Unit 1
- 2814 Phillip Dr
- 2755 Sheldon Rd
- 253 Frances Dr
- 239 Frances Dr
- 211 Frances Dr
- 36661 N Oakwood Dr
- 941 Martingale Ln
- 21290 W Engle Dr
- 21556 W Sarah Dr
- 2354 Scott Ct
- 36866 N Nathan Hale Dr Unit N
- 36909 N Marilyn Ln
- 2346 Ashbrook Ln
- 36664 N Helen Dr
- 2325 N Lenox Ct
- 36818 N Corona Dr
- 36915 N Mary Dr
- 2332 N Fox Chase Dr Unit 2
- 2322 N Fox Chase Dr
- 2305 N Fox Chase Dr Unit 2
- 2323 N Fox Chase Dr
- 2333 N Fox Chase Dr Unit 2
- 2313 N Fox Chase Dr Unit 2
- 1338 E Fox Chase Dr
- 1336 E Fox Chase Dr
- 2340 N Fox Chase Dr
- 2343 N Fox Chase Dr Unit 2
- 2350 N Fox Chase Dr
- 2325 N Greystone Dr
- 2345 N Greystone Dr
- 2318 N Wildwood Dr
- 2355 N Fox Chase Dr
- 292 Crozier Dr
- 2353 N Greystone Dr
- 2360 N Fox Chase Dr
- 1331 E Fox Chase Dr
- 1327 E Fox Chase Dr