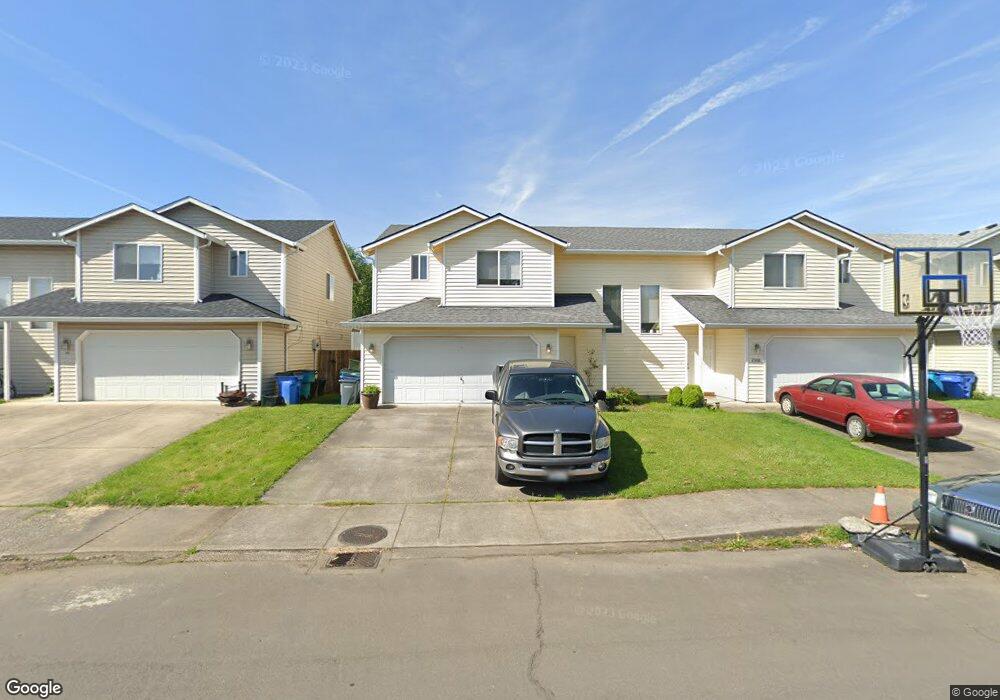
2310 NW 4th St Battle Ground, WA 98604
Estimated Value: $605,577 - $809,000
6
Beds
4
Baths
3,058
Sq Ft
$232/Sq Ft
Est. Value
About This Home
This home is located at 2310 NW 4th St, Battle Ground, WA 98604 and is currently estimated at $708,394, approximately $231 per square foot. 2310 NW 4th St is a home located in Clark County with nearby schools including Daybreak Primary School, Daybreak Middle School, and Battle Ground High School.
Ownership History
Date
Name
Owned For
Owner Type
Purchase Details
Closed on
Sep 13, 2010
Sold by
Finicle Gary Alan
Bought by
Finicle Gary A and Finicle Sherry L
Current Estimated Value
Home Financials for this Owner
Home Financials are based on the most recent Mortgage that was taken out on this home.
Original Mortgage
$196,000
Interest Rate
4.45%
Mortgage Type
New Conventional
Purchase Details
Closed on
Dec 18, 2001
Sold by
Finicle Sherry L
Bought by
Finicle Gary Alan
Home Financials for this Owner
Home Financials are based on the most recent Mortgage that was taken out on this home.
Original Mortgage
$210,000
Interest Rate
6.39%
Purchase Details
Closed on
May 11, 2001
Sold by
Lewisville Meadows Llc
Bought by
Distinctive Homes Inc
Home Financials for this Owner
Home Financials are based on the most recent Mortgage that was taken out on this home.
Original Mortgage
$197,600
Interest Rate
7.03%
Create a Home Valuation Report for This Property
The Home Valuation Report is an in-depth analysis detailing your home's value as well as a comparison with similar homes in the area
Home Values in the Area
Average Home Value in this Area
Purchase History
| Date | Buyer | Sale Price | Title Company |
|---|---|---|---|
| Finicle Gary A | -- | Clark County Title | |
| Finicle Gary Alan | -- | First American Title Ins Co | |
| Finicle Gary Alan | $233,700 | First American Title Ins Co | |
| Distinctive Homes Inc | -- | First American Title Ins Co |
Source: Public Records
Mortgage History
| Date | Status | Borrower | Loan Amount |
|---|---|---|---|
| Closed | Finicle Gary A | $196,000 | |
| Closed | Finicle Gary Alan | $210,000 | |
| Previous Owner | Distinctive Homes Inc | $197,600 |
Source: Public Records
Tax History Compared to Growth
Tax History
| Year | Tax Paid | Tax Assessment Tax Assessment Total Assessment is a certain percentage of the fair market value that is determined by local assessors to be the total taxable value of land and additions on the property. | Land | Improvement |
|---|---|---|---|---|
| 2025 | $4,569 | $549,812 | $140,000 | $409,812 |
| 2024 | $3,879 | $560,505 | $140,000 | $420,505 |
| 2023 | $4,305 | $541,372 | $140,000 | $401,372 |
| 2022 | $4,157 | $547,899 | $123,250 | $424,649 |
| 2021 | $3,931 | $459,668 | $106,250 | $353,418 |
| 2020 | $3,237 | $398,600 | $97,750 | $300,850 |
| 2019 | $2,652 | $371,879 | $100,300 | $271,579 |
| 2018 | $3,420 | $356,579 | $0 | $0 |
| 2017 | $3,085 | $337,822 | $0 | $0 |
| 2016 | $2,982 | $331,958 | $0 | $0 |
| 2015 | $2,955 | $294,430 | $0 | $0 |
| 2014 | -- | $276,780 | $0 | $0 |
| 2013 | -- | $250,519 | $0 | $0 |
Source: Public Records
Map
Nearby Homes
- 810 NW 25th Ave
- 802 NW 20th Ave
- 344 NW 29th Way
- 2401 NW 10th Way
- 1807 NW 3rd St
- 1802 NW 3rd St
- 151 NW 30th Ave
- 0 NW 2nd St Unit 2 & 3 780233409
- 0 NW 2nd St Unit 3 282019710
- 0 NW 2nd St Unit 2 167106682
- 1608 NW 3rd St
- 2514 W Main St
- 1600 NW 3rd St
- 1210 NW 24th Ave
- 1507 NW 5th Common
- 1114 NW 19th Ave
- 1501 NW 5th Common
- 2013 NW 13th St
- 2301 SW 5th Cir
- 2307 SW 5th Cir
- 2306 NW 4th St
- 2314 NW 4th St
- 2316 NW 4th St
- 2307 NW 5th St
- 2303 NW 5th St
- 2309 NW 4th St
- 2218 NW 4th St
- 2402 NW 4th St
- 2400 2402 NW 4th St Unit 1&2
- 2400 2402 NW 4th St
- 2311 NW 5th St
- 2225 NW 5th St
- 2313 NW 4th St
- 2301 NW 4th St
- 2303 NW 4th St
- 2221 NW 5th St
- 2315 NW 5th St
- 2408 NW 4th St
- 2219 NW 4th St
- 2407 NW 3rd Way