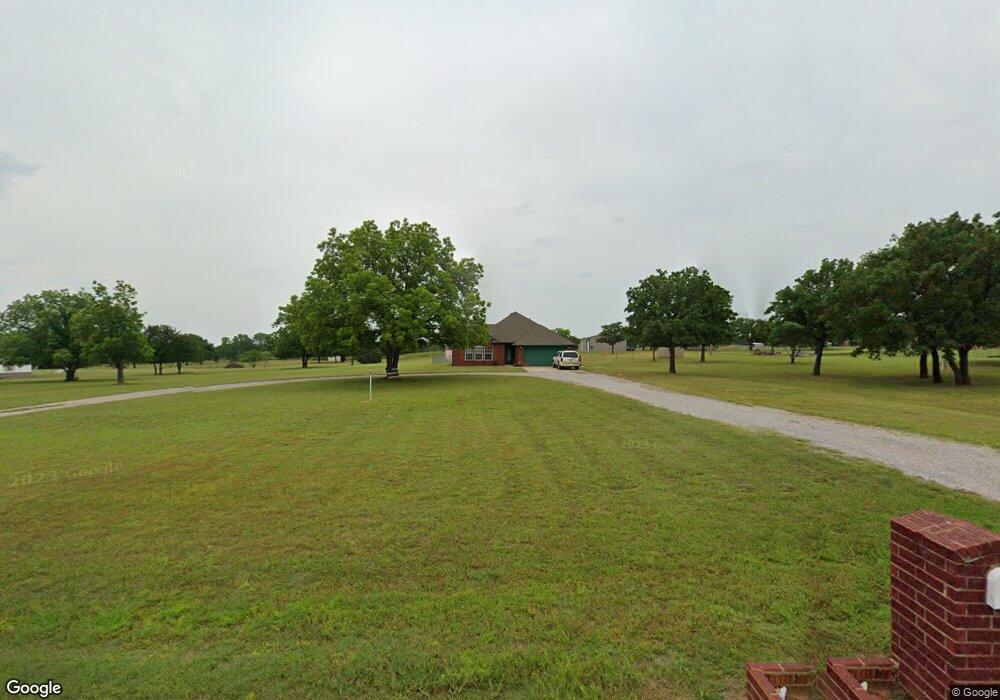
2310 W Terry Rd Duncan, OK 73533
Estimated Value: $251,000 - $304,000
3
Beds
2
Baths
1,767
Sq Ft
$158/Sq Ft
Est. Value
About This Home
This home is located at 2310 W Terry Rd, Duncan, OK 73533 and is currently estimated at $279,054, approximately $157 per square foot. 2310 W Terry Rd is a home with nearby schools including Comanche Elementary School, Comanche Middle School, and Comanche High School.
Ownership History
Date
Name
Owned For
Owner Type
Purchase Details
Closed on
Nov 23, 2013
Sold by
Slann Leonard J and Slann Christine A
Bought by
Johnson Shanon R and Johnson Deanna D
Current Estimated Value
Home Financials for this Owner
Home Financials are based on the most recent Mortgage that was taken out on this home.
Original Mortgage
$162,000
Outstanding Balance
$121,337
Interest Rate
4.34%
Mortgage Type
New Conventional
Estimated Equity
$157,717
Purchase Details
Closed on
May 31, 2007
Sold by
Gardner Tim and Gardner Julia Ann
Bought by
Slann Lenord J and Slann Christin A
Home Financials for this Owner
Home Financials are based on the most recent Mortgage that was taken out on this home.
Original Mortgage
$126,000
Interest Rate
6.15%
Mortgage Type
New Conventional
Purchase Details
Closed on
Jan 16, 2004
Sold by
Headley Jeremy and Headley Jami
Create a Home Valuation Report for This Property
The Home Valuation Report is an in-depth analysis detailing your home's value as well as a comparison with similar homes in the area
Home Values in the Area
Average Home Value in this Area
Purchase History
| Date | Buyer | Sale Price | Title Company |
|---|---|---|---|
| Johnson Shanon R | $180,000 | None Available | |
| Slann Lenord J | $157,500 | None Available | |
| -- | $17,000 | -- |
Source: Public Records
Mortgage History
| Date | Status | Borrower | Loan Amount |
|---|---|---|---|
| Open | Johnson Shanon R | $162,000 | |
| Previous Owner | Slann Lenord J | $126,000 |
Source: Public Records
Tax History Compared to Growth
Tax History
| Year | Tax Paid | Tax Assessment Tax Assessment Total Assessment is a certain percentage of the fair market value that is determined by local assessors to be the total taxable value of land and additions on the property. | Land | Improvement |
|---|---|---|---|---|
| 2025 | $2,055 | $24,545 | $1,494 | $23,051 |
| 2024 | $2,055 | $24,171 | $1,332 | $22,839 |
| 2023 | $2,055 | $24,170 | $1,355 | $22,815 |
| 2022 | $1,971 | $23,467 | $1,310 | $22,157 |
| 2021 | $2,011 | $22,783 | $1,226 | $21,557 |
| 2020 | $1,876 | $21,475 | $1,226 | $20,249 |
| 2019 | $2,038 | $21,198 | $1,226 | $19,972 |
| 2018 | $2,030 | $21,212 | $1,226 | $19,986 |
| 2017 | $1,713 | $20,458 | $1,226 | $19,232 |
| 2016 | $1,670 | $19,879 | $1,226 | $18,653 |
| 2015 | $1,515 | $19,879 | $1,226 | $18,653 |
| 2014 | $1,515 | $19,879 | $1,226 | $18,653 |
Source: Public Records
Map
Nearby Homes
- 177025 N 2810 Rd
- 177074 Stephens Dr
- 3889 Kensworth Dr
- 176883 176883 N 2800 Rd
- 4001 4001 Collinsworth Dr
- 281550 E 1800 Rd
- 282096 Andrews Dr
- 5204 Kevin Dr
- 180163 Larue Dr
- ???? S 2nd St
- 2710 2710 S 27th St
- 0 S 2nd St
- 277637 Rd
- 1407 1407 S King Place
- 1114 1114 S 10th St
- 1109 W Stephens Ave
- 0 W Stephens Ave
- 000 Doctor Pepper Rd
- 168466 9 Mile Rd
- 1223 S 42nd St