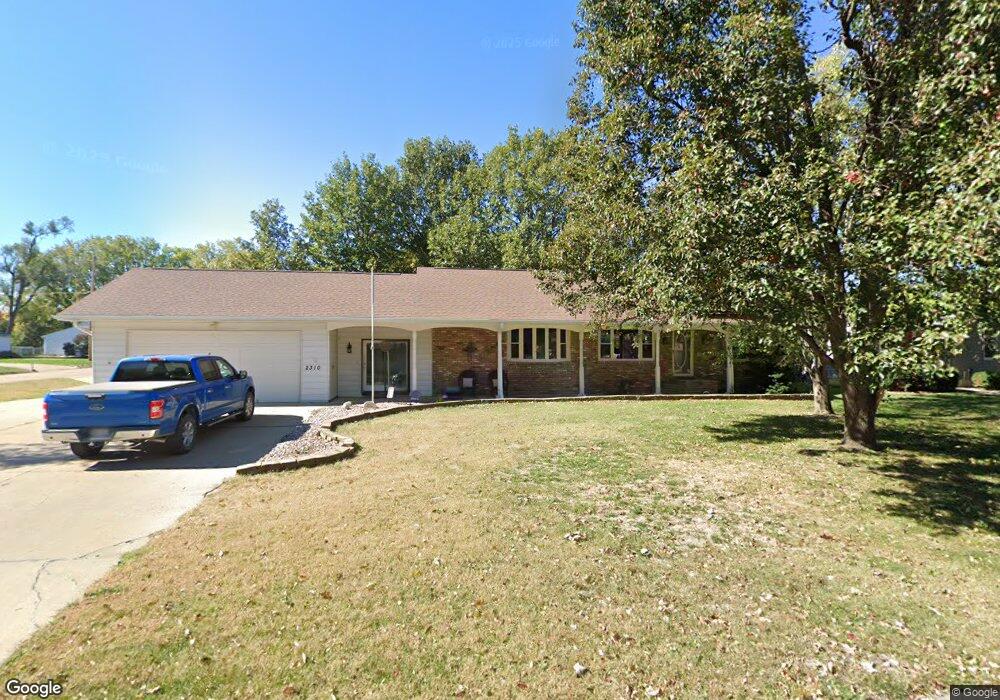
2310 Warren St Bellevue, NE 68005
Estimated Value: $258,000 - $283,000
2
Beds
2
Baths
1,416
Sq Ft
$193/Sq Ft
Est. Value
About This Home
This home is located at 2310 Warren St, Bellevue, NE 68005 and is currently estimated at $272,615, approximately $192 per square foot. 2310 Warren St is a home located in Sarpy County with nearby schools including Betz Elementary School, Bellevue Mission Middle School, and Bellevue East High School.
Ownership History
Date
Name
Owned For
Owner Type
Purchase Details
Closed on
Jun 2, 2021
Sold by
Schleip Jeannie and Thomas Jeannie
Bought by
Thomas Jeannie and Thomas Justin
Current Estimated Value
Home Financials for this Owner
Home Financials are based on the most recent Mortgage that was taken out on this home.
Original Mortgage
$198,000
Outstanding Balance
$179,264
Interest Rate
2.9%
Mortgage Type
New Conventional
Estimated Equity
$93,351
Purchase Details
Closed on
Oct 3, 2019
Sold by
Huscroft Sonya
Bought by
Schleip Duane and Schleip Susie
Home Financials for this Owner
Home Financials are based on the most recent Mortgage that was taken out on this home.
Original Mortgage
$196,615
Interest Rate
3.72%
Mortgage Type
New Conventional
Purchase Details
Closed on
May 7, 2003
Sold by
Cooper Alta Louise
Bought by
Cooper Clarence Edward
Create a Home Valuation Report for This Property
The Home Valuation Report is an in-depth analysis detailing your home's value as well as a comparison with similar homes in the area
Home Values in the Area
Average Home Value in this Area
Purchase History
| Date | Buyer | Sale Price | Title Company |
|---|---|---|---|
| Thomas Jeannie | -- | Midwest Title | |
| Schleip Duane | $215,000 | Dri Title & Escrow | |
| Cooper Clarence Edward | -- | -- |
Source: Public Records
Mortgage History
| Date | Status | Borrower | Loan Amount |
|---|---|---|---|
| Open | Thomas Jeannie | $198,000 | |
| Previous Owner | Schleip Duane | $196,615 |
Source: Public Records
Tax History Compared to Growth
Tax History
| Year | Tax Paid | Tax Assessment Tax Assessment Total Assessment is a certain percentage of the fair market value that is determined by local assessors to be the total taxable value of land and additions on the property. | Land | Improvement |
|---|---|---|---|---|
| 2025 | $4,742 | $299,129 | $34,000 | $265,129 |
| 2024 | $5,042 | $270,250 | $29,000 | $241,250 |
| 2023 | $5,042 | $238,799 | $29,000 | $209,799 |
| 2022 | $4,514 | $209,764 | $24,000 | $185,764 |
| 2021 | $4,325 | $198,851 | $22,000 | $176,851 |
| 2020 | $4,263 | $195,342 | $22,000 | $173,342 |
| 2019 | $4,171 | $192,334 | $22,000 | $170,334 |
| 2018 | $3,866 | $183,071 | $22,000 | $161,071 |
| 2017 | $3,741 | $175,924 | $22,000 | $153,924 |
| 2016 | $3,475 | $167,046 | $22,000 | $145,046 |
| 2015 | $3,334 | $161,179 | $22,000 | $139,179 |
| 2014 | $3,283 | $157,711 | $22,000 | $135,711 |
| 2012 | -- | $156,728 | $22,000 | $134,728 |
Source: Public Records
Map
Nearby Homes
- 2232 Wilson Dr
- 2504 Main St
- 2507 Hancock St
- 2519 Hancock St
- 2111 Washington St
- 2512 Washington St
- 2709 Franklin St
- 2503 Wayne St
- 1807 Warren St
- 101 E 28th Ave
- 1801 Franklin St
- 1601 Main St
- 706 W Mission Ave
- 409 W 30th Ave
- 2602 Crawford St
- 1322 Hancock St
- 2807 Calhoun St
- 2701 Clay St
- 2807 Clay St
- 306 37th Place