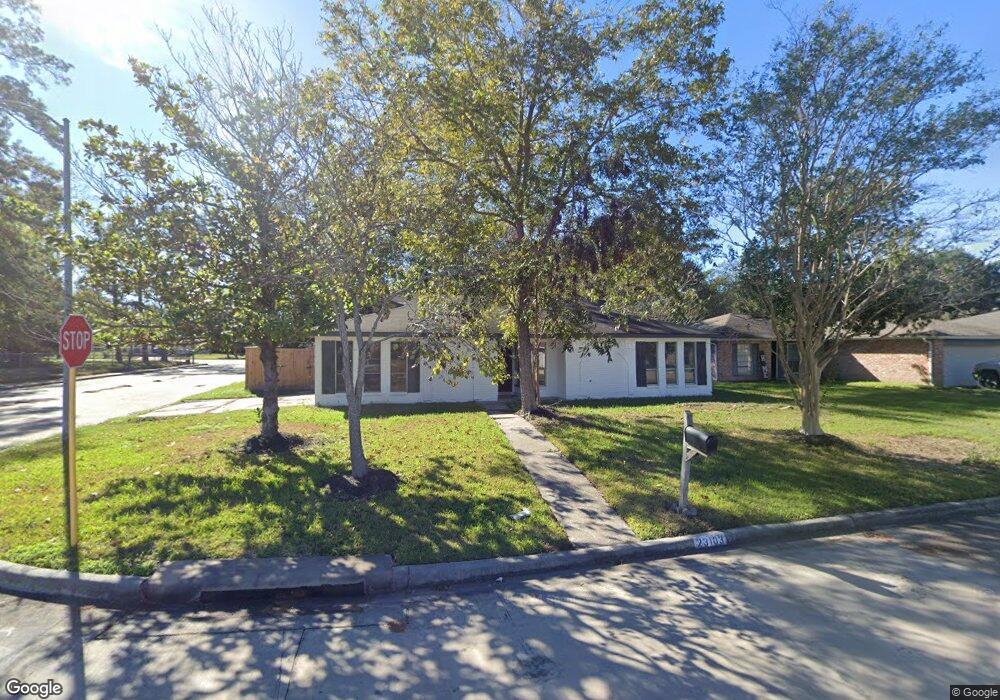
23103 Summergate Dr Spring, TX 77373
Estimated Value: $182,000 - $208,000
3
Beds
2
Baths
1,284
Sq Ft
$152/Sq Ft
Est. Value
About This Home
This home is located at 23103 Summergate Dr, Spring, TX 77373 and is currently estimated at $195,372, approximately $152 per square foot. 23103 Summergate Dr is a home located in Harris County with nearby schools including Mildred Jenkins Elementary School, Dueitt Middle School, and Spring High School.
Ownership History
Date
Name
Owned For
Owner Type
Purchase Details
Closed on
May 12, 2022
Sold by
Isla Ilomes Llc
Bought by
Garay Josue Avisahi Gara and Reyes Oscar Armando
Current Estimated Value
Home Financials for this Owner
Home Financials are based on the most recent Mortgage that was taken out on this home.
Original Mortgage
$183,600
Outstanding Balance
$174,494
Interest Rate
5.3%
Mortgage Type
Balloon
Estimated Equity
$20,878
Purchase Details
Closed on
Jan 12, 2022
Sold by
Noland Alma D
Bought by
Isla Homes Llc
Purchase Details
Closed on
Mar 18, 1997
Sold by
Federal National Mortgage Association
Bought by
Noland George W and Noland Alma D
Purchase Details
Closed on
Nov 5, 1996
Sold by
Dasigenis Sandy
Bought by
Ge Capital Mtg Services Inc
Purchase Details
Closed on
Nov 22, 1993
Sold by
Casagrande Leo and Casagrande Grace D
Bought by
Cornett Mary L
Create a Home Valuation Report for This Property
The Home Valuation Report is an in-depth analysis detailing your home's value as well as a comparison with similar homes in the area
Home Values in the Area
Average Home Value in this Area
Purchase History
| Date | Buyer | Sale Price | Title Company |
|---|---|---|---|
| Garay Josue Avisahi Gara | -- | None Listed On Document | |
| Isla Homes Llc | -- | None Listed On Document | |
| Noland George W | -- | Texas American Title Company | |
| Ge Capital Mtg Services Inc | $41,040 | -- | |
| Cornett Mary L | -- | Houston Title Company |
Source: Public Records
Mortgage History
| Date | Status | Borrower | Loan Amount |
|---|---|---|---|
| Open | Garay Josue Avisahi Gara | $183,600 |
Source: Public Records
Tax History
| Year | Tax Paid | Tax Assessment Tax Assessment Total Assessment is a certain percentage of the fair market value that is determined by local assessors to be the total taxable value of land and additions on the property. | Land | Improvement |
|---|---|---|---|---|
| 2025 | $3,484 | $169,183 | $50,153 | $119,030 |
| 2024 | $3,484 | $178,001 | $50,153 | $127,848 |
| 2023 | $3,484 | $183,750 | $50,153 | $133,597 |
| 2022 | $2,934 | $168,738 | $50,423 | $118,315 |
| 2021 | $2,827 | $125,336 | $17,503 | $107,833 |
| 2020 | $2,729 | $109,835 | $17,503 | $92,332 |
| 2019 | $2,558 | $108,644 | $17,503 | $91,141 |
| 2018 | $89 | $96,962 | $17,503 | $79,459 |
| 2017 | $2,066 | $96,962 | $17,503 | $79,459 |
| 2016 | $1,878 | $87,770 | $17,503 | $70,267 |
| 2015 | $359 | $77,571 | $17,503 | $60,068 |
| 2014 | $359 | $62,397 | $17,503 | $44,894 |
Source: Public Records
Map
Nearby Homes
- 23122 Summergate Dr
- 4606 Fitzwater Dr
- 23122 Cimber Ln
- 23202 Summergate Dr
- 23127 Harpergate Dr
- 4551 Algernon Dr
- 23115 Lestergate Dr
- 23123 Lestergate Dr
- 4527 Adonis Dr
- 4411 Monteith Dr
- 4519 Tylergate Dr
- 22823 W Fairfax Village Cir
- 23430 Wintergate Dr
- 4922 Glendower Dr
- 4822 S Fairfax Village Cir
- 4127 Adonis Dr
- 4330 Tylergate Dr
- 4322 Towergate Dr
- 26114 Halwell Manor Ln
- 4014 Algernon Dr
- 23107 Summergate Dr
- 23102 Ludgate Dr
- 23106 Ludgate Dr
- 23111 Summergate Dr
- 23102 Summergate Dr
- 23106 Summergate Dr
- 23115 Summergate Dr
- 23114 Ludgate Dr
- 23110 Summergate Dr
- 23119 Summergate Dr
- 23114 Summergate Dr
- 23118 Ludgate Dr
- 23103 Ludgate Dr
- 23107 Ludgate Dr
- 23103 Wintergate Dr
- 23107 Wintergate Dr
- 4535 Reynaldo Dr
- 23111 Ludgate Dr
- 23111 Wintergate Dr
- 23118 Summergate Dr
Your Personal Tour Guide
Ask me questions while you tour the home.