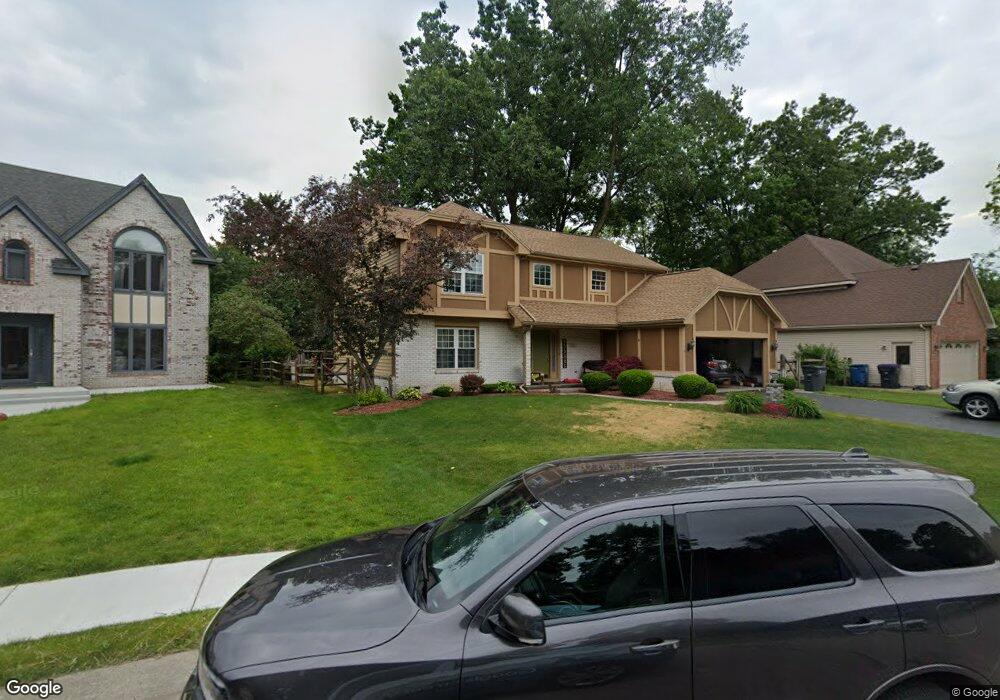
2311 Eversham Ct Toledo, OH 43617
Estimated Value: $368,000 - $431,000
4
Beds
3
Baths
2,836
Sq Ft
$141/Sq Ft
Est. Value
About This Home
This home is located at 2311 Eversham Ct, Toledo, OH 43617 and is currently estimated at $399,539, approximately $140 per square foot. 2311 Eversham Ct is a home located in Lucas County with nearby schools including Central Trail Elementary School, Sylvania Timberstone Junior High School, and Sylvania Southview High School.
Ownership History
Date
Name
Owned For
Owner Type
Purchase Details
Closed on
Jun 17, 2006
Sold by
Taylor Lloyd W and Taylor Deanna K
Bought by
Mcneal Edward C
Current Estimated Value
Home Financials for this Owner
Home Financials are based on the most recent Mortgage that was taken out on this home.
Original Mortgage
$241,700
Interest Rate
6.5%
Mortgage Type
Purchase Money Mortgage
Purchase Details
Closed on
Aug 7, 2002
Sold by
Mark Shusternyak and Shuster Mark
Bought by
Taylor Lloyd W and Taylor Deanna K
Home Financials for this Owner
Home Financials are based on the most recent Mortgage that was taken out on this home.
Original Mortgage
$204,200
Interest Rate
4.5%
Purchase Details
Closed on
May 31, 1994
Sold by
Szymanski Rodney P
Purchase Details
Closed on
Aug 1, 1988
Sold by
Teegarden Janice
Purchase Details
Closed on
Mar 8, 1988
Create a Home Valuation Report for This Property
The Home Valuation Report is an in-depth analysis detailing your home's value as well as a comparison with similar homes in the area
Home Values in the Area
Average Home Value in this Area
Purchase History
| Date | Buyer | Sale Price | Title Company |
|---|---|---|---|
| Mcneal Edward C | $241,700 | Chicago Title Insurance Co | |
| Taylor Lloyd W | $229,900 | Metro Title Agency Inc | |
| -- | $193,000 | -- | |
| -- | $165,000 | -- | |
| -- | $37,900 | -- |
Source: Public Records
Mortgage History
| Date | Status | Borrower | Loan Amount |
|---|---|---|---|
| Previous Owner | Mcneal Edward C | $241,700 | |
| Previous Owner | Taylor Lloyd W | $204,200 |
Source: Public Records
Tax History
| Year | Tax Paid | Tax Assessment Tax Assessment Total Assessment is a certain percentage of the fair market value that is determined by local assessors to be the total taxable value of land and additions on the property. | Land | Improvement |
|---|---|---|---|---|
| 2025 | -- | $142,275 | $17,850 | $124,425 |
| 2024 | $9,647 | $142,275 | $17,850 | $124,425 |
| 2023 | $8,014 | $106,330 | $17,010 | $89,320 |
| 2022 | $8,019 | $106,330 | $17,010 | $89,320 |
| 2021 | $8,212 | $106,330 | $17,010 | $89,320 |
| 2020 | $8,844 | $101,500 | $16,520 | $84,980 |
| 2019 | $8,519 | $101,500 | $16,520 | $84,980 |
| 2018 | $7,445 | $101,500 | $16,520 | $84,980 |
| 2017 | $6,901 | $74,655 | $11,095 | $63,560 |
| 2016 | $6,770 | $213,300 | $31,700 | $181,600 |
| 2015 | $6,386 | $213,300 | $31,700 | $181,600 |
| 2014 | $6,037 | $71,790 | $10,680 | $61,110 |
| 2013 | $6,037 | $71,790 | $10,680 | $61,110 |
Source: Public Records
Map
Nearby Homes
- 7233 Turncreek Dr
- 2015 King Rd
- 6927 Regents Park Blvd
- 7043 Mourning Dove Ct
- 2110 Austin Bluffs Ct
- 2355 Parliament Square
- 2132 The Bluffs Unit 2132
- 1053 Plum Grove Ln
- 7032 Cinnamon Teal Ct
- 1025 Plum Grove Ln
- 1015 Plumcreek Rd
- 6955 Dorr St Unit 64
- 6753 Carrie Pine Ln
- 608 Tall Pines Dr
- 8241 Bucks Run Ct
- 6241 W Pembridge Dr
- 2051 Centennial Rd
- 1809 Birdie Dr
- 148 Curwood Rd
- 1944 Silverpine Ct
- 2317 Eversham Ct
- 2307 Eversham Ct
- 2325 Eversham Ct
- 2306 Gibley Park Rd
- 2310 Gibley Park Rd
- 2303 Eversham Ct
- 2318 Gibley Park Rd
- 2314 Eversham Ct
- 2320 Eversham Ct
- 2302 Gibley Park Rd
- 2331 Eversham Ct
- 2302 Eversham Ct
- 7326 Friarton Cir
- 2310 Eversham Ct
- 2326 Eversham Ct
- 2306 Eversham Ct
- 2328 Gibley Park Rd
- 7320 Friarton Cir
- 7332 Friarton Cir
- 2332 Eversham Ct
Your Personal Tour Guide
Ask me questions while you tour the home.