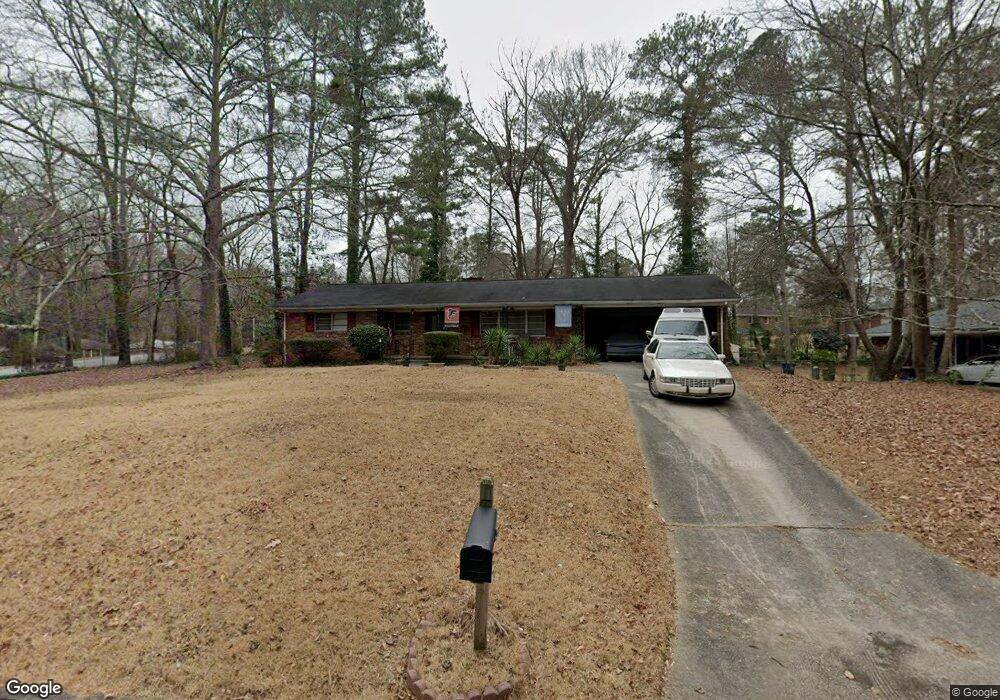
2311 Farley St Atlanta, GA 30344
Estimated Value: $242,898 - $274,000
3
Beds
2
Baths
1,584
Sq Ft
$162/Sq Ft
Est. Value
About This Home
This home is located at 2311 Farley St, Atlanta, GA 30344 and is currently estimated at $256,725, approximately $162 per square foot. 2311 Farley St is a home located in Fulton County with nearby schools including Hamilton E. Holmes Elementary School, Paul D. West Middle School, and Tri-Cities High School.
Ownership History
Date
Name
Owned For
Owner Type
Purchase Details
Closed on
Jan 25, 2019
Sold by
Cordia Homes I Llc
Bought by
Cordia Georgia 2 Llc
Current Estimated Value
Purchase Details
Closed on
Apr 10, 2014
Sold by
Cordia Georgia Llc
Bought by
Cordia Homes I Llc
Purchase Details
Closed on
Dec 14, 2012
Sold by
Peymax Properties Inc
Bought by
Cordia Georgia Llc
Purchase Details
Closed on
Oct 5, 2010
Sold by
Peymax Properties Inc
Bought by
Janus Collections Llc
Purchase Details
Closed on
Dec 1, 2009
Sold by
Sheriff Of Fulton County
Bought by
Slatus Shlomo
Purchase Details
Closed on
Feb 23, 2005
Sold by
Natt Geraldine
Bought by
Peymax Props Inc
Purchase Details
Closed on
Jun 5, 2000
Sold by
Schell Kim B and Schell Michael D
Bought by
Natt Geraldine
Home Financials for this Owner
Home Financials are based on the most recent Mortgage that was taken out on this home.
Original Mortgage
$85,456
Interest Rate
8.11%
Mortgage Type
FHA
Purchase Details
Closed on
Feb 17, 1995
Sold by
Butler Gloria
Bought by
Schell Kim B
Create a Home Valuation Report for This Property
The Home Valuation Report is an in-depth analysis detailing your home's value as well as a comparison with similar homes in the area
Home Values in the Area
Average Home Value in this Area
Purchase History
| Date | Buyer | Sale Price | Title Company |
|---|---|---|---|
| Cordia Georgia 2 Llc | -- | -- | |
| Cordia Homes I Llc | -- | -- | |
| Cordia Georgia Llc | $40,000 | -- | |
| Janus Collections Llc | $7,778 | -- | |
| Slatus Shlomo | $27,000 | -- | |
| Peymax Props Inc | $86,000 | -- | |
| Natt Geraldine | $85,500 | -- | |
| Schell Kim B | $32,800 | -- |
Source: Public Records
Mortgage History
| Date | Status | Borrower | Loan Amount |
|---|---|---|---|
| Previous Owner | Natt Geraldine | $85,456 | |
| Closed | Schell Kim B | $0 |
Source: Public Records
Tax History Compared to Growth
Tax History
| Year | Tax Paid | Tax Assessment Tax Assessment Total Assessment is a certain percentage of the fair market value that is determined by local assessors to be the total taxable value of land and additions on the property. | Land | Improvement |
|---|---|---|---|---|
| 2025 | $1,608 | $115,280 | $47,520 | $67,760 |
| 2023 | $3,254 | $115,280 | $47,520 | $67,760 |
| 2022 | $2,450 | $93,120 | $13,080 | $80,040 |
| 2021 | $906 | $70,680 | $11,800 | $58,880 |
| 2020 | $2,616 | $60,760 | $9,000 | $51,760 |
| 2019 | $799 | $51,240 | $8,720 | $42,520 |
| 2018 | $935 | $33,120 | $5,200 | $27,920 |
| 2017 | $447 | $15,320 | $3,840 | $11,480 |
| 2016 | $447 | $15,320 | $3,840 | $11,480 |
| 2015 | $789 | $15,320 | $3,840 | $11,480 |
| 2014 | $470 | $15,320 | $3,840 | $11,480 |
Source: Public Records
Map
Nearby Homes
- 2364 Farley St
- 2370 Farley St
- 2228 Headland Dr
- 2271 Plantation Dr
- 2134 Elinwood Dr
- 2284 Headland Dr
- 2382 Ridgecrest Ln
- 2313 Manor Ave
- 2435 Wood Valley Dr
- 0 Headland Dr Unit 7498493
- 0 Headland Dr Unit 10427733
- 0 Headland Dr Unit 10463222
- 2361 Bonner Rd
- 2442 Graywall St
- 00 Headland Dr
- 2334 Connally Dr
- 2126 Connally Dr
- 2177 Connally Dr
- 2478 Graywall St
- 2019 Connally Dr
- 2303 Farley St
- 2207 Bonner Rd
- 2215 Bonner Rd
- 2296 Farley Ct
- 2223 Bonner Rd Unit 10
- 2295 Farley St
- 2229 Bonner Rd
- 2294 Farley St
- 2286 Farley Ct
- 2235 Bonner Rd
- 2287 Farley St
- 2176 Elinwood Dr
- 2287 Farley Ct
- 2338 Farley St
- 2243 Bonner Rd
- 2181 Elinwood Dr
- 2286 Farley St Unit 3
- 2278 Farley Ct Unit 3
- 2168 Elinwood Dr
- 2357 Farley St