2311 Inyo St Los Osos, CA 93402
Estimated Value: $948,000 - $1,192,000
About This Home
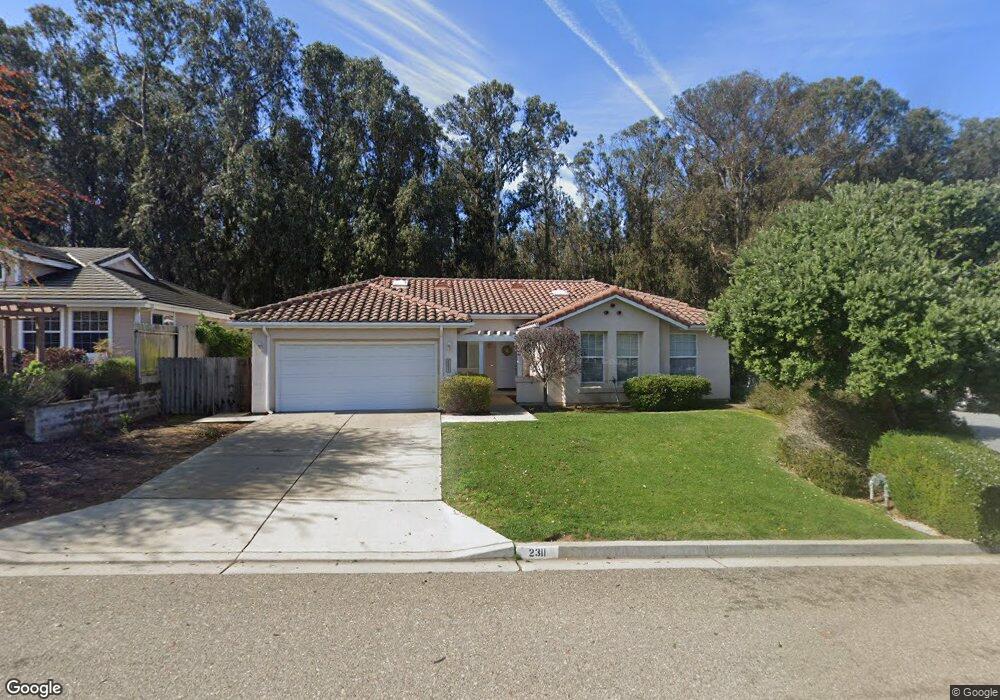
This home is located at 2311 Inyo St, Los Osos, CA 93402 and is currently estimated at $1,052,249, approximately $565 per square foot. 2311 Inyo St is a home located in San Luis Obispo County with nearby schools including Monarch Grove Elementary School, Los Osos Middle School, and Morro Bay High School.
Ownership History
We collect this data history from publicly available records. To have your information removed, we recommend requesting removal directly through your county’s website.
Purchase Details
Home Financials for this Owner
Home Financials are based on the most recent Mortgage that was taken out on this home.Home Values in the Area
Average Home Value in this Area
Purchase History
We collect this data history from publicly available records. To have your information removed, we recommend requesting removal directly through your county’s website.
| Date | Buyer | Sale Price | Title Company |
|---|---|---|---|
| $222,000 | Fidelity National Title Co |
Mortgage History
We collect this data history from publicly available records. To have your information removed, we recommend requesting removal directly through your county’s website.
| Date | Status | Borrower | Loan Amount |
|---|---|---|---|
| Previous Owner | $82,000 |
Tax History
We collect this data history from publicly available records. To have your information removed, we recommend requesting removal directly through your county’s website.
| Year | Tax Paid | Tax Assessment Tax Assessment Total Assessment is a certain percentage of the fair market value that is determined by local assessors to be the total taxable value of land and additions on the property. | Land | Improvement |
|---|---|---|---|---|
| 2025 | $5,827 | $348,011 | $156,761 | $191,250 |
| 2024 | $5,668 | $341,188 | $153,688 | $187,500 |
| 2023 | $5,668 | $334,499 | $150,675 | $183,824 |
| 2022 | $6,012 | $327,941 | $147,721 | $180,220 |
| 2021 | $5,764 | $321,512 | $144,825 | $176,687 |
| 2020 | $5,288 | $318,216 | $143,340 | $174,876 |
| 2019 | $5,023 | $311,978 | $140,530 | $171,448 |
| 2018 | $3,310 | $305,862 | $137,775 | $168,087 |
| 2017 | $3,243 | $299,866 | $135,074 | $164,792 |
| 2016 | $3,178 | $293,987 | $132,426 | $161,561 |
| 2015 | $3,128 | $289,572 | $130,437 | $159,135 |
| 2014 | $2,878 | $283,900 | $127,882 | $156,018 |
Map
- 2265 Del Norte St
- 242 Vista Ct
- 1924 Nevada Ct
- 224 Butte Dr
- 230 Butte Dr
- 203 Madera St
- 200 Madera St
- 2493 San Sebastian Ln
- 85 Costa Azul
- 286 San Leandro Ave
- 1940 Aspen St
- 2743 Rodman Dr
- 487 Henrietta Ave
- 0 Garden St
- 2775 Rodman Dr
- 2796 Crockett Cir
- 1850 Doris Ave
- 370 Mitchell Dr
- 1840 Pine Ave
- 1830 Pine Ave
Ask me questions while you tour the home.