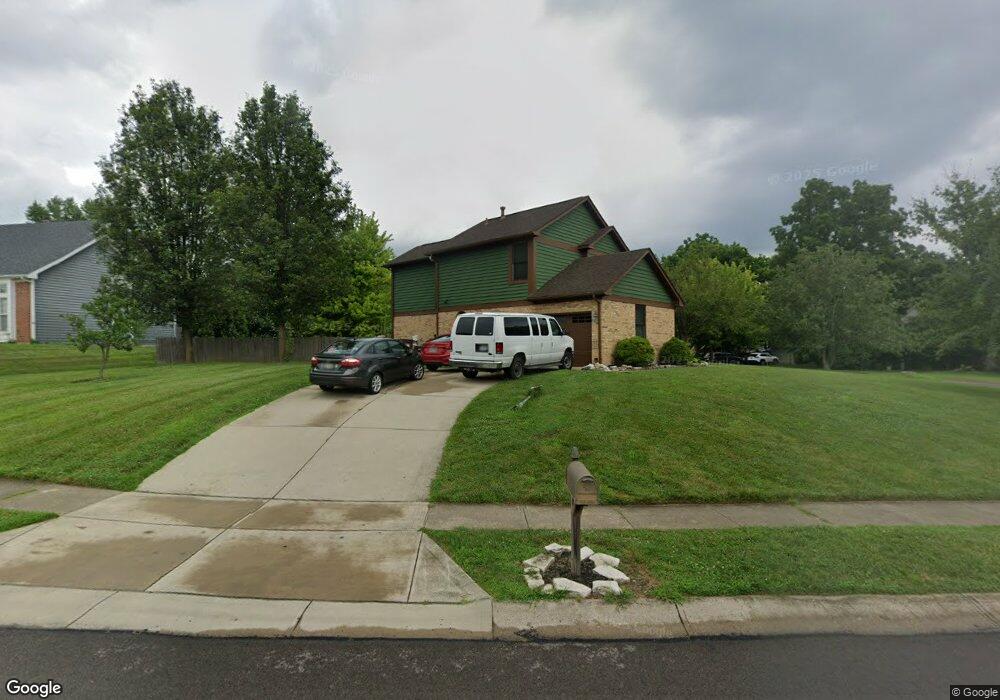
2311 Munger Pointe Dr Dayton, OH 45459
Woodbourne-Hyde Park NeighborhoodEstimated Value: $386,000 - $418,000
4
Beds
3
Baths
2,923
Sq Ft
$137/Sq Ft
Est. Value
About This Home
This home is located at 2311 Munger Pointe Dr, Dayton, OH 45459 and is currently estimated at $401,132, approximately $137 per square foot. 2311 Munger Pointe Dr is a home located in Montgomery County with nearby schools including West Carrollton High School, Miami Valley Academies, and Bishop Leibold School.
Ownership History
Date
Name
Owned For
Owner Type
Purchase Details
Closed on
Jul 13, 2018
Sold by
Smith Jaclyn A and Smith Jeffrey M
Bought by
Goldman Joshua B and Goldman Brandi A
Current Estimated Value
Home Financials for this Owner
Home Financials are based on the most recent Mortgage that was taken out on this home.
Original Mortgage
$352,000
Outstanding Balance
$297,698
Interest Rate
3.75%
Mortgage Type
Adjustable Rate Mortgage/ARM
Estimated Equity
$103,434
Purchase Details
Closed on
Jan 4, 2010
Sold by
Smith Jaclyn A and Smith Jeffrey M
Bought by
Smith Jaclyn A and Smith Jeffrey M
Purchase Details
Closed on
Aug 22, 1995
Sold by
Gelatt Daniel E and Gelatt Joyce E
Bought by
Smith Jaclyn A and Smith Jeffrey M
Create a Home Valuation Report for This Property
The Home Valuation Report is an in-depth analysis detailing your home's value as well as a comparison with similar homes in the area
Home Values in the Area
Average Home Value in this Area
Purchase History
| Date | Buyer | Sale Price | Title Company |
|---|---|---|---|
| Goldman Joshua B | $250,000 | Sterling Land Title Agency I | |
| Smith Jaclyn A | -- | Attorney | |
| Smith Jaclyn A | -- | -- |
Source: Public Records
Mortgage History
| Date | Status | Borrower | Loan Amount |
|---|---|---|---|
| Open | Goldman Joshua B | $352,000 |
Source: Public Records
Tax History
| Year | Tax Paid | Tax Assessment Tax Assessment Total Assessment is a certain percentage of the fair market value that is determined by local assessors to be the total taxable value of land and additions on the property. | Land | Improvement |
|---|---|---|---|---|
| 2025 | $7,972 | $111,800 | $19,320 | $92,480 |
| 2024 | $7,834 | $111,800 | $19,320 | $92,480 |
| 2023 | $7,834 | $111,800 | $19,320 | $92,480 |
| 2022 | $7,181 | $81,060 | $14,000 | $67,060 |
| 2021 | $6,796 | $81,060 | $14,000 | $67,060 |
| 2020 | $6,706 | $81,060 | $14,000 | $67,060 |
| 2019 | $6,672 | $70,540 | $14,000 | $56,540 |
| 2018 | $6,234 | $70,540 | $14,000 | $56,540 |
| 2017 | $6,195 | $70,540 | $14,000 | $56,540 |
| 2016 | $5,731 | $63,160 | $14,000 | $49,160 |
| 2015 | $5,317 | $63,160 | $14,000 | $49,160 |
| 2014 | $5,317 | $63,160 | $14,000 | $49,160 |
| 2012 | -- | $69,540 | $15,750 | $53,790 |
Source: Public Records
Map
Nearby Homes
- 6230 Overture Dr
- 6260 Overture Dr
- 2766 Symphony Way
- 5622 Harlamert Dr
- 2708 Eckley Blvd
- 5510 Willowtwig Ln
- 6571 Swissway Dr
- 5450 Dunmore Dr Unit 25450
- 2063 Brandy Mill Ln Unit 4
- 2421 W Alex Bell Rd
- 2281 Crew Cir Unit D2281
- 6630 Carinthia Dr
- 2215 Crew Cir Unit E2215
- 5585 Cobblegate Dr Unit 935
- 5458 Lamme Rd Unit F5458
- 6524 Halberd Ct
- 6864 Rose Glen Dr
- 6300 Carnation Rd
- 2347 Spring Rose Dr
- 2308 Vienna Pkwy
- 6085 Munger Rd
- 2319 Munger Pointe Dr
- 2310 Munger Pointe Dr
- 2281 Robleigh Dr
- 6080 Munger Rd
- 2327 Munger Pointe Dr
- 2300 Loris Dr
- 2312 Loris Dr
- 6131 Munger Rd
- 2280 Robleigh Dr
- 6110 Suzanne Cir
- 2335 Munger Pointe Dr
- 2324 Loris Dr
- 2261 Robleigh Dr
- 6111 Suzanne Cir
- 6120 Suzanne Cir
- 2260 Robleigh Dr
- 6001 Munger Rd
- 2336 Loris Dr
- 2343 Munger Pointe Dr
Your Personal Tour Guide
Ask me questions while you tour the home.