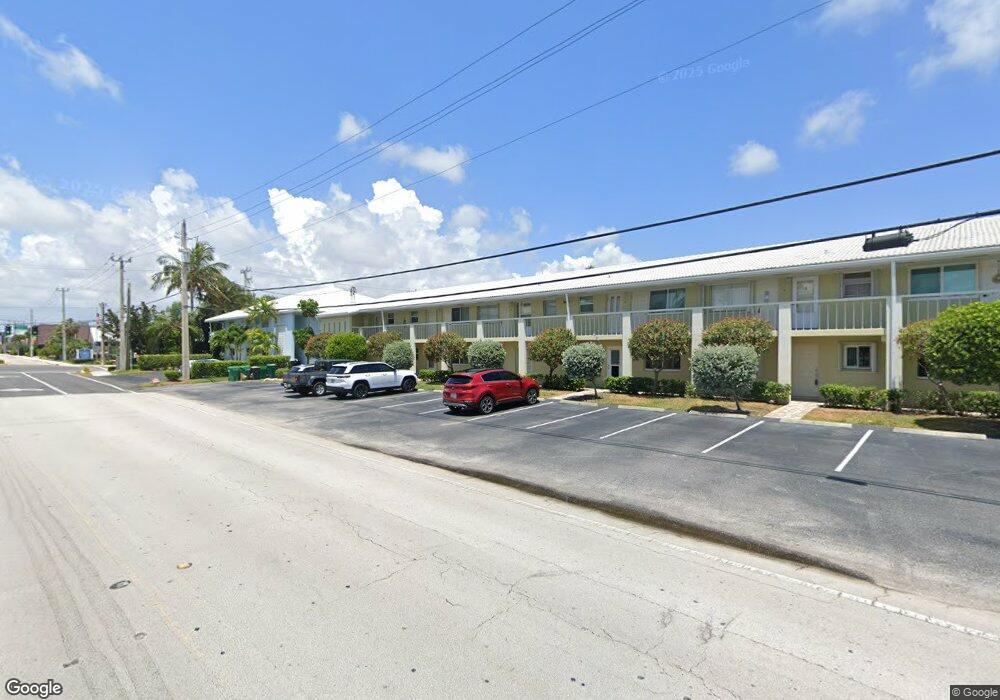
2311 NE 36th St Unit 2D Lighthouse Point, FL 33064
Estimated Value: $266,000 - $401,000
2
Beds
1
Bath
747
Sq Ft
$418/Sq Ft
Est. Value
About This Home
This home is located at 2311 NE 36th St Unit 2D, Lighthouse Point, FL 33064 and is currently estimated at $312,211, approximately $417 per square foot. 2311 NE 36th St Unit 2D is a home located in Broward County with nearby schools including Norcrest Elementary School, Deerfield Beach Middle School, and Deerfield Beach High School.
Ownership History
Date
Name
Owned For
Owner Type
Purchase Details
Closed on
Dec 27, 2011
Sold by
Bankunited
Bought by
Eliades Jordan and Vlachaki Alexandra Mavrou
Current Estimated Value
Purchase Details
Closed on
Jun 28, 2011
Sold by
Campbell Ronald M
Bought by
Bankunited
Purchase Details
Closed on
Jul 20, 2009
Sold by
Hikin Barry and Vella Maryann
Bought by
Campbell Teddy
Purchase Details
Closed on
Jun 26, 2003
Sold by
Bender Raymond F and Bender Shirley F
Bought by
Campbell Ronald M
Home Financials for this Owner
Home Financials are based on the most recent Mortgage that was taken out on this home.
Original Mortgage
$100,000
Interest Rate
5.43%
Mortgage Type
Purchase Money Mortgage
Purchase Details
Closed on
May 21, 2001
Sold by
Hampton House Condo Assn Inc C
Bought by
Bender Raymond F and Bender Shirley F
Create a Home Valuation Report for This Property
The Home Valuation Report is an in-depth analysis detailing your home's value as well as a comparison with similar homes in the area
Home Values in the Area
Average Home Value in this Area
Purchase History
We collect this data history from publicly available records. To have your information removed, we recommend requesting removal directly through your county’s website.
| Date | Buyer | Sale Price | Title Company |
|---|---|---|---|
| Eliades Jordan | $94,400 | None Available | |
| Bankunited | $60,600 | None Available | |
| Campbell Teddy | -- | None Available | |
| Campbell Ronald M | $125,000 | -- | |
| Bender Raymond F | -- | -- |
Source: Public Records
Mortgage History
We collect this data history from publicly available records. To have your information removed, we recommend requesting removal directly through your county’s website.
| Date | Status | Borrower | Loan Amount |
|---|---|---|---|
| Previous Owner | Campbell Ronald M | $100,000 |
Source: Public Records
Tax History
| Year | Tax Paid | Tax Assessment Tax Assessment Total Assessment is a certain percentage of the fair market value that is determined by local assessors to be the total taxable value of land and additions on the property. | Land | Improvement |
|---|---|---|---|---|
| 2026 | $6,397 | $270,700 | $27,070 | $243,630 |
| 2025 | $2,621 | $138,670 | -- | -- |
| 2024 | $2,572 | $134,770 | -- | -- |
| 2023 | $2,572 | $130,850 | $0 | $0 |
| 2022 | $2,232 | $127,040 | $0 | $0 |
| 2021 | $2,164 | $123,340 | $0 | $0 |
| 2020 | $2,074 | $121,640 | $0 | $0 |
| 2019 | $2,024 | $118,910 | $0 | $0 |
| 2018 | $1,913 | $116,700 | $0 | $0 |
| 2017 | $1,806 | $114,300 | $0 | $0 |
| 2016 | $1,773 | $111,950 | $0 | $0 |
| 2015 | $1,457 | $111,180 | $0 | $0 |
| 2014 | $1,466 | $110,300 | $0 | $0 |
| 2013 | -- | $108,670 | $10,870 | $97,800 |
Source: Public Records
Map
Nearby Homes
- 2311 NE 36th St Unit 2F
- 2311 NE 36th St Unit 2A
- 2301 NE 36th St Unit 202
- 2330 NE 36th St Unit 11
- 2400 NE 36th St Unit 3
- 2400 NE 36th St Unit 12
- 3700 NE 24th Ave
- 2248 NE 37th St
- 2511 NE 36th St
- 2330 NE 35th St
- 2210 NE 36th St Unit A&B
- 2211 NE 35th Ct
- 3701 NE 26th Ave
- 2320 NE 34th Ct
- 2300 NE 34th Ct
- 2202 NE 36th St Unit 15
- 2134 NE 36th St Unit 82
- 2130 NE 36th St Unit 63
- 2220 NE 34th Ct
- 2231 NE 34th St
- 2311 NE 36th St Unit 2G
- 2311 NE 36th St Unit 2E
- 2311 NE 36th St Unit 2C
- 2311 NE 36th St Unit 1B
- 2311 NE 36th St Unit 1C
- 2311 NE 36th St Unit 1E
- 2311 NE 36th St Unit 1D
- 2311 NE 36th St Unit 2B
- 2311 NE 36th St
- 2301 NE 36th St Unit 106
- 2301 NE 36th St Unit 107
- 2301 NE 36th St Unit 103
- 2301 NE 36th St Unit 205
- 2301 NE 36th St Unit 104
- 2301 NE 36th St Unit 207
- 2301 NE 36th St Unit 102
- 2301 NE 36th St Unit 203
- 2301 NE 36th St Unit 105
- 2301 NE 36th St Unit 101
- 2301 NE 36th St Unit 206
Your Personal Tour Guide
Ask me questions while you tour the home.