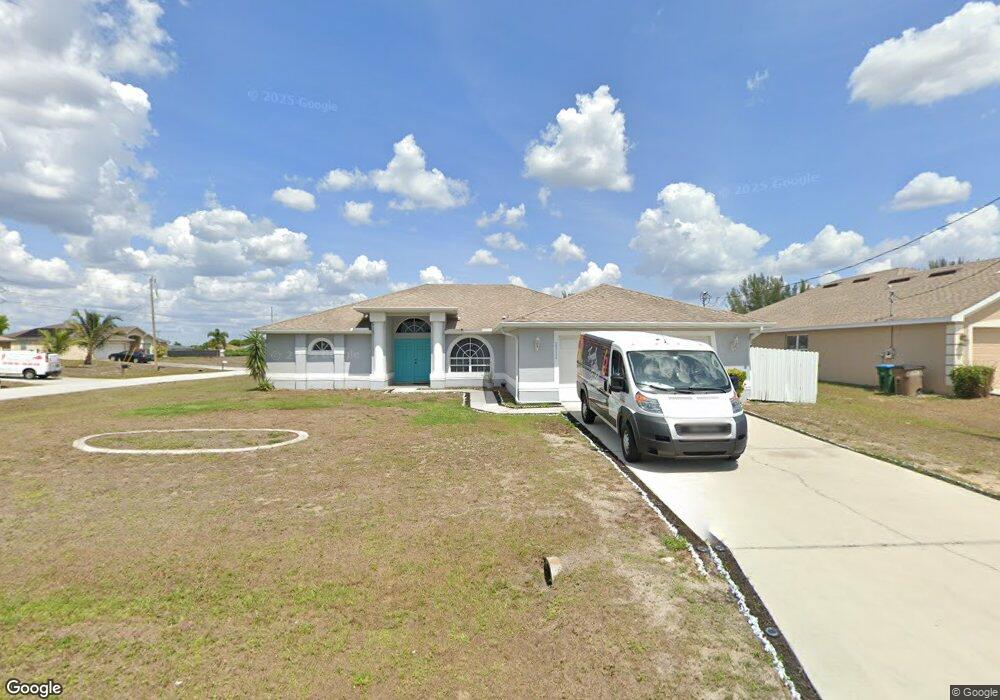
2311 NW 3rd Ave Cape Coral, FL 33993
Mariner NeighborhoodEstimated Value: $307,811 - $413,000
4
Beds
3
Baths
2,479
Sq Ft
$150/Sq Ft
Est. Value
About This Home
This home is located at 2311 NW 3rd Ave, Cape Coral, FL 33993 and is currently estimated at $372,703, approximately $150 per square foot. 2311 NW 3rd Ave is a home located in Lee County with nearby schools including Dr. Carrie D. Robinson Littleton Elementary School, Caloosa Elementary School, and Tropic Isles Elementary School.
Ownership History
Date
Name
Owned For
Owner Type
Purchase Details
Closed on
Jun 30, 2015
Sold by
Alvarez Emiliano D
Bought by
Alvarez Emiliano D and Alvarez Isidra L
Current Estimated Value
Purchase Details
Closed on
Sep 6, 2006
Sold by
Ashjai Llc
Bought by
Alvarez Emiliano
Purchase Details
Closed on
Sep 1, 2006
Sold by
Ashjai Llc
Bought by
Alvarez Emiliano
Purchase Details
Closed on
Oct 7, 2005
Sold by
Metropolis Construction Inc
Bought by
Ashjai Llc
Purchase Details
Closed on
Jan 25, 2005
Sold by
Florida Building Contractors Inc
Bought by
Metropolis Constructions Inc
Purchase Details
Closed on
Nov 10, 2003
Sold by
Hayes Susan G
Bought by
Equity Tr Co and Suzanne Boss I R A
Purchase Details
Closed on
Dec 2, 2002
Sold by
Lewis William D
Bought by
Hayes Susan G
Purchase Details
Closed on
Nov 25, 2002
Sold by
Lewis William D and Fuller Doris M
Bought by
Hayes Susan G
Create a Home Valuation Report for This Property
The Home Valuation Report is an in-depth analysis detailing your home's value as well as a comparison with similar homes in the area
Home Values in the Area
Average Home Value in this Area
Purchase History
| Date | Buyer | Sale Price | Title Company |
|---|---|---|---|
| Alvarez Emiliano D | -- | Attorney | |
| Alvarez Emiliano | $44,000 | Bay Title Services | |
| Alvarez Emiliano | $44,000 | Bay Title Services | |
| Ashjai Llc | $85,000 | Florida West Coast Title Ins | |
| Metropolis Constructions Inc | $30,000 | -- | |
| Equity Tr Co | $16,000 | -- | |
| Hayes Susan G | $3,000 | -- | |
| Hayes Susan G | -- | -- |
Source: Public Records
Tax History Compared to Growth
Tax History
| Year | Tax Paid | Tax Assessment Tax Assessment Total Assessment is a certain percentage of the fair market value that is determined by local assessors to be the total taxable value of land and additions on the property. | Land | Improvement |
|---|---|---|---|---|
| 2025 | $5,136 | $280,329 | $35,530 | $236,964 |
| 2024 | $5,346 | $269,603 | $38,244 | $223,264 |
| 2023 | $5,346 | $257,326 | $0 | $0 |
| 2022 | $4,844 | $233,933 | $0 | $0 |
| 2021 | $4,312 | $212,666 | $16,270 | $196,396 |
| 2020 | $4,145 | $198,634 | $9,200 | $189,434 |
| 2019 | $3,870 | $192,989 | $10,500 | $182,489 |
| 2018 | $3,753 | $194,603 | $10,500 | $184,103 |
| 2017 | $3,603 | $188,945 | $6,800 | $182,145 |
| 2016 | $3,266 | $162,923 | $12,964 | $149,959 |
| 2015 | $3,037 | $145,811 | $11,881 | $133,930 |
| 2014 | -- | $130,501 | $10,906 | $119,595 |
| 2013 | -- | $113,206 | $8,981 | $104,225 |
Source: Public Records
Map
Nearby Homes
- 219 NW 23rd Terrace
- 2236 NW 2nd Place
- 210 NW 23rd Terrace
- 2227 NW 3rd Ave
- 2236 NW 2nd Ave
- 2219 NW 3rd Ave
- 318 Kismet Pkwy W
- 2234 NW 2nd Ave
- 327 NW 23rd St
- 2231 NW 2nd Ave
- 218 NW 25th St
- 110 NW 24th Terrace
- 2227 NW 1st Place
- 404 NW 24th Terrace
- 2201 NW 2nd Ave
- 2118 NW 2nd Ave
- 401 NW 24th Terrace
- 32 NW 24th Terrace
- 2108 NW 2nd Place
- 111 NW 25th St
- 2307 NW 3rd Ave
- 300 NW 23rd Terrace
- 231 NW 23rd Terrace
- 2303 NW 3rd Ave
- 301 NW 23rd St
- 301 NW 23rd St
- 223 NW 23rd Terrace
- 308 NW 23 Terrace
- 305 NW 23rd St
- 305 NW 23rd St
- 305 NW 23rd St Unit 39
- 234 Kismet Pkwy W
- 214 NW 23rd Terrace
- 2236 NW 2nd Place Unit 36
- 2231 NW 3rd Ave
- 226 Kismet Pkwy W
- 300 Kismet Pkwy W
- 215 NW 23rd Terrace Unit 39
- 215 NW 23rd Terrace
- 2230 NW 3rd Ave