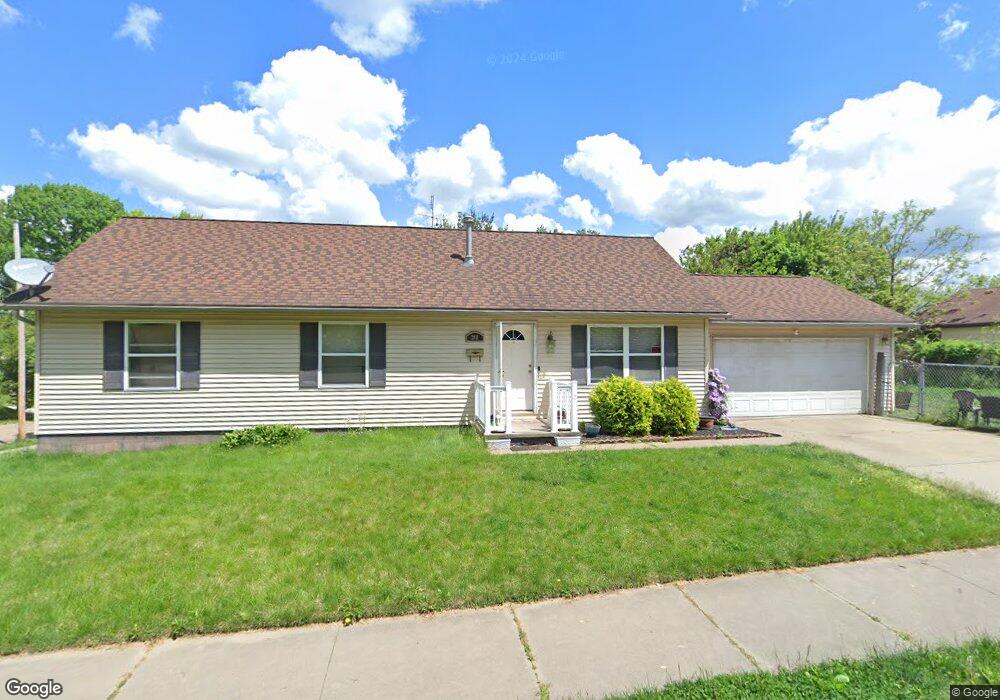
2311 Pelton Ave Akron, OH 44314
Kenmore NeighborhoodEstimated Value: $139,000 - $169,537
2
Beds
2
Baths
1,152
Sq Ft
$133/Sq Ft
Est. Value
About This Home
This home is located at 2311 Pelton Ave, Akron, OH 44314 and is currently estimated at $153,134, approximately $132 per square foot. 2311 Pelton Ave is a home located in Summit County with nearby schools including Sam Salem Community Learning Center.
Ownership History
Date
Name
Owned For
Owner Type
Purchase Details
Closed on
Mar 29, 2004
Sold by
Ohio Premier Homes Inc
Bought by
Tucker Jason T and Tucker Kari S
Current Estimated Value
Home Financials for this Owner
Home Financials are based on the most recent Mortgage that was taken out on this home.
Original Mortgage
$91,920
Outstanding Balance
$43,226
Interest Rate
5.65%
Mortgage Type
Purchase Money Mortgage
Estimated Equity
$109,908
Purchase Details
Closed on
Oct 10, 2003
Sold by
Tarle Amy and Tarle Ernest J
Bought by
Zimmerman Mike
Purchase Details
Closed on
Oct 8, 2003
Sold by
Marchion Jeffrey A and Marchion Julie B
Bought by
Tarle Amy
Purchase Details
Closed on
Apr 2, 1998
Sold by
Prease Janice A
Bought by
Marchion Jeffrey A and Marchion Julie B
Home Financials for this Owner
Home Financials are based on the most recent Mortgage that was taken out on this home.
Original Mortgage
$62,759
Interest Rate
7.09%
Mortgage Type
FHA
Create a Home Valuation Report for This Property
The Home Valuation Report is an in-depth analysis detailing your home's value as well as a comparison with similar homes in the area
Home Values in the Area
Average Home Value in this Area
Purchase History
| Date | Buyer | Sale Price | Title Company |
|---|---|---|---|
| Tucker Jason T | $114,900 | Multiple | |
| Zimmerman Mike | $14,000 | Multiple | |
| Tarle Amy | $10,000 | Multiple | |
| Marchion Jeffrey A | $62,250 | -- |
Source: Public Records
Mortgage History
| Date | Status | Borrower | Loan Amount |
|---|---|---|---|
| Open | Tucker Jason T | $91,920 | |
| Previous Owner | Marchion Jeffrey A | $62,759 | |
| Closed | Tucker Jason T | $17,235 |
Source: Public Records
Tax History Compared to Growth
Tax History
| Year | Tax Paid | Tax Assessment Tax Assessment Total Assessment is a certain percentage of the fair market value that is determined by local assessors to be the total taxable value of land and additions on the property. | Land | Improvement |
|---|---|---|---|---|
| 2025 | $2,849 | $50,289 | $8,635 | $41,654 |
| 2024 | $2,849 | $50,289 | $8,635 | $41,654 |
| 2023 | $2,849 | $50,289 | $8,635 | $41,654 |
| 2022 | $2,256 | $30,664 | $5,264 | $25,400 |
| 2021 | $2,258 | $30,664 | $5,264 | $25,400 |
| 2020 | $2,227 | $30,660 | $5,260 | $25,400 |
| 2019 | $2,339 | $30,230 | $6,120 | $24,110 |
| 2018 | $2,309 | $30,230 | $6,120 | $24,110 |
| 2017 | $2,512 | $30,230 | $6,120 | $24,110 |
| 2016 | $2,514 | $32,600 | $6,580 | $26,020 |
| 2015 | $2,512 | $32,600 | $6,580 | $26,020 |
| 2014 | $2,493 | $32,600 | $6,580 | $26,020 |
| 2013 | $2,584 | $34,630 | $6,580 | $28,050 |
Source: Public Records
Map
Nearby Homes
- 451 Allenford St
- 2365 Pelton Ave
- 363 Lockwood St
- 355 Lockwood St
- 590 Flora Ave
- 364 Rexford St
- 636 Flora Ave
- 2513 Christensen Ave
- 2531 Pelton Ave
- 2303 6th St SW
- 2199 6th St SW
- 2238 7th St SW
- 2186 5th St SW
- 2323 11th St SW
- 2332 11th St SW
- 2291 11th St SW
- 75 W Dartmore Ave
- 2278 11th St SW
- 592 Sharon St
- 2134 7th St SW
- 454 Westmoreland St
- 450 Westmoreland St
- 468 Westmoreland St
- 451 Celtic St
- 453 Westmoreland St
- 2324 Pelton Ave
- 474 Westmoreland St
- 2295 Pelton Ave
- 442 Westmoreland St
- 441 Celtic St
- 429 Celtic St
- 443 Westmoreland St
- 436 Westmoreland St
- 471 Westmoreland St
- 480 Westmoreland St
- 471 Celtic St
- 439 Westmoreland St
- 477 Westmoreland St
- 435 Westmoreland St
- 486 Westmoreland St