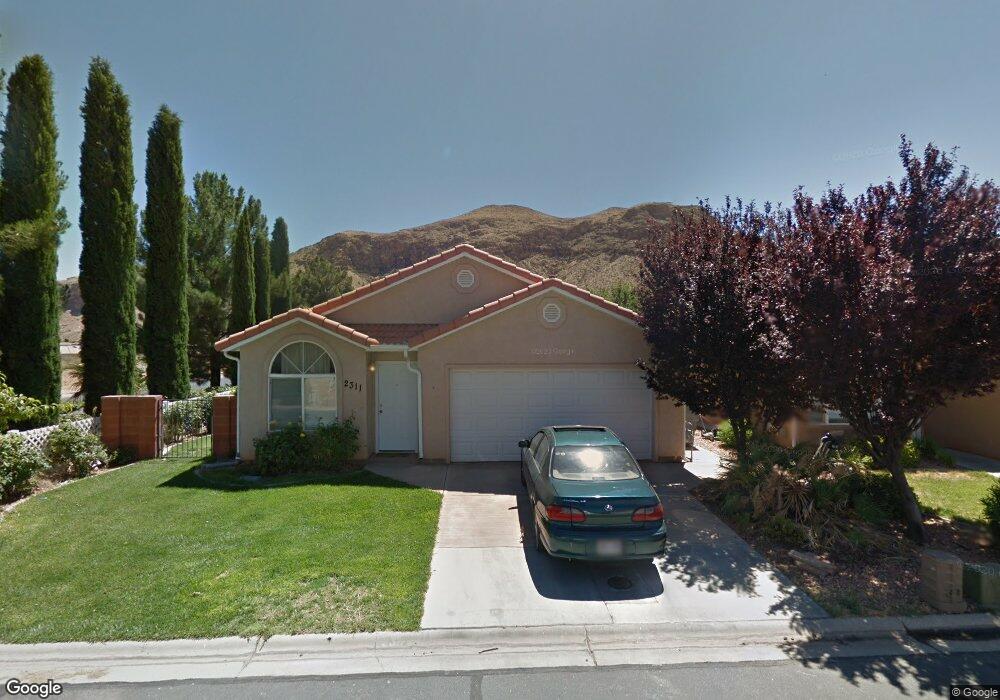
2311 S 780 W Hurricane, UT 84737
Estimated Value: $317,000 - $372,000
3
Beds
2
Baths
1,202
Sq Ft
$281/Sq Ft
Est. Value
About This Home
This home is located at 2311 S 780 W, Hurricane, UT 84737 and is currently estimated at $337,971, approximately $281 per square foot. 2311 S 780 W is a home located in Washington County with nearby schools including Hurricane Intermediate School, Three Falls School, and Hurricane High School.
Ownership History
Date
Name
Owned For
Owner Type
Purchase Details
Closed on
Jul 26, 2011
Sold by
Jb Holdings Llc
Bought by
Wallace Robert J and Wallace Amanda D
Current Estimated Value
Home Financials for this Owner
Home Financials are based on the most recent Mortgage that was taken out on this home.
Original Mortgage
$108,808
Outstanding Balance
$74,950
Interest Rate
4.46%
Mortgage Type
New Conventional
Estimated Equity
$263,021
Purchase Details
Closed on
Apr 25, 2011
Sold by
Blackmore Lane
Bought by
Jb Holding Llc
Purchase Details
Closed on
Apr 19, 2011
Sold by
Blackmore Lane
Bought by
Jb Holding Llc
Purchase Details
Closed on
Apr 29, 2010
Sold by
Lindhardt Nina and Garfield Anne
Bought by
Blackmore Lane
Home Financials for this Owner
Home Financials are based on the most recent Mortgage that was taken out on this home.
Original Mortgage
$20,000
Interest Rate
5.03%
Mortgage Type
Seller Take Back
Create a Home Valuation Report for This Property
The Home Valuation Report is an in-depth analysis detailing your home's value as well as a comparison with similar homes in the area
Purchase History
| Date | Buyer | Sale Price | Title Company |
|---|---|---|---|
| Wallace Robert J | -- | Southern Utah Title | |
| Jb Holding Llc | -- | None Available | |
| Jb Holding Llc | -- | None Available | |
| Blackmore Lane | -- | None Available |
Source: Public Records
Mortgage History
| Date | Status | Borrower | Loan Amount |
|---|---|---|---|
| Open | Wallace Robert J | $108,808 | |
| Previous Owner | Blackmore Lane | $20,000 |
Source: Public Records
Tax History
| Year | Tax Paid | Tax Assessment Tax Assessment Total Assessment is a certain percentage of the fair market value that is determined by local assessors to be the total taxable value of land and additions on the property. | Land | Improvement |
|---|---|---|---|---|
| 2025 | $1,326 | $176,550 | $44,000 | $132,550 |
| 2023 | $1,325 | $177,705 | $41,250 | $136,455 |
| 2022 | $1,392 | $175,065 | $38,500 | $136,565 |
| 2021 | $1,214 | $225,600 | $50,000 | $175,600 |
| 2020 | $1,144 | $198,800 | $50,000 | $148,800 |
| 2019 | $1,050 | $177,000 | $40,000 | $137,000 |
| 2018 | $1,004 | $83,710 | $0 | $0 |
| 2017 | $903 | $75,295 | $0 | $0 |
| 2016 | $834 | $67,375 | $0 | $0 |
| 2015 | $810 | $63,030 | $0 | $0 |
| 2014 | $693 | $56,100 | $0 | $0 |
Source: Public Records
Map
Nearby Homes
- 2356 S 770 W
- 2422 S 675 W
- 2432 S 675 W
- 2451 S 675 W
- 781 W 2500 S
- 2192 S Angell Heights Dr
- 2005 S 950 W
- 1108 N Florence Cir
- 296 E 1100 N Unit 19
- 296 E 1100 N
- 997 W 1800 S
- 1762 S 920 W
- 3997 W 1500 S
- 953 W Rock View Dr
- 1546 S 4000 W Unit Lot 10
- 1536 S 4020 W
- 1504 S 4000 W Unit Lot 9
- 1504 S 4000 W
- 2202 Angel Heights Dr
- 282 W 1480 S