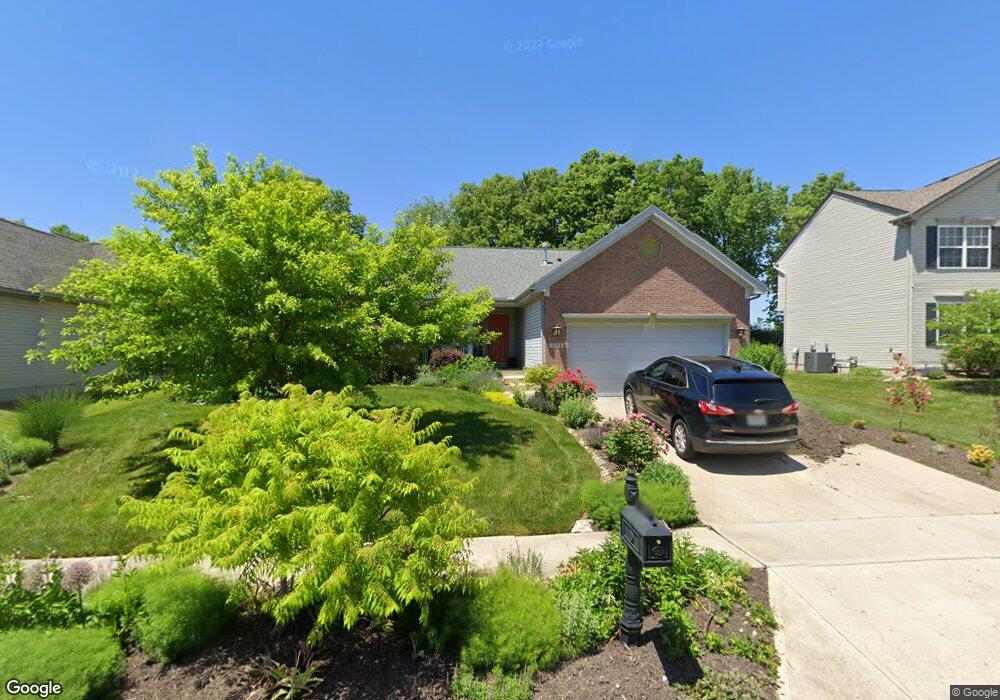
2311 Weston Dr Fairborn, OH 45324
Estimated Value: $314,521 - $345,000
3
Beds
2
Baths
1,512
Sq Ft
$220/Sq Ft
Est. Value
About This Home
This home is located at 2311 Weston Dr, Fairborn, OH 45324 and is currently estimated at $332,130, approximately $219 per square foot. 2311 Weston Dr is a home located in Greene County with nearby schools including Fairborn Primary School, Fairborn Intermediate School, and Fairborn Middle School.
Ownership History
Date
Name
Owned For
Owner Type
Purchase Details
Closed on
Oct 3, 2016
Sold by
Shumway Michael J
Bought by
Paxson Stephanie L
Current Estimated Value
Home Financials for this Owner
Home Financials are based on the most recent Mortgage that was taken out on this home.
Original Mortgage
$283,000
Outstanding Balance
$223,433
Interest Rate
2.99%
Mortgage Type
New Conventional
Estimated Equity
$108,697
Purchase Details
Closed on
Jul 5, 2016
Bought by
Shumway Michael J
Purchase Details
Closed on
Dec 22, 2005
Sold by
Inverness Group Inc
Bought by
Shumway Michael J and Shumway Judith L
Home Financials for this Owner
Home Financials are based on the most recent Mortgage that was taken out on this home.
Original Mortgage
$179,027
Interest Rate
6.48%
Mortgage Type
Fannie Mae Freddie Mac
Purchase Details
Closed on
Sep 13, 2005
Sold by
Hills Land & Development Co
Bought by
Inverness Group Inc
Home Financials for this Owner
Home Financials are based on the most recent Mortgage that was taken out on this home.
Original Mortgage
$15,000,000
Interest Rate
5.83%
Mortgage Type
Purchase Money Mortgage
Create a Home Valuation Report for This Property
The Home Valuation Report is an in-depth analysis detailing your home's value as well as a comparison with similar homes in the area
Home Values in the Area
Average Home Value in this Area
Purchase History
| Date | Buyer | Sale Price | Title Company |
|---|---|---|---|
| Paxson Stephanie L | $179,900 | Attorney | |
| Shumway Michael J | -- | -- | |
| Shumway Michael J | $188,500 | -- | |
| Inverness Group Inc | $32,500 | -- |
Source: Public Records
Mortgage History
| Date | Status | Borrower | Loan Amount |
|---|---|---|---|
| Open | Paxson Stephanie L | $283,000 | |
| Previous Owner | Shumway Michael J | $179,027 | |
| Previous Owner | Inverness Group Inc | $15,000,000 |
Source: Public Records
Tax History Compared to Growth
Tax History
| Year | Tax Paid | Tax Assessment Tax Assessment Total Assessment is a certain percentage of the fair market value that is determined by local assessors to be the total taxable value of land and additions on the property. | Land | Improvement |
|---|---|---|---|---|
| 2024 | $4,096 | $87,610 | $16,660 | $70,950 |
| 2023 | $4,096 | $87,610 | $16,660 | $70,950 |
| 2022 | $3,694 | $65,380 | $13,880 | $51,500 |
| 2021 | $3,751 | $65,380 | $13,880 | $51,500 |
| 2020 | $3,772 | $65,380 | $13,880 | $51,500 |
| 2019 | $3,357 | $58,200 | $12,360 | $45,840 |
| 2018 | $3,394 | $58,200 | $12,360 | $45,840 |
| 2017 | $2,864 | $58,200 | $12,360 | $45,840 |
| 2016 | $2,865 | $57,590 | $12,360 | $45,230 |
| 2015 | $2,734 | $57,590 | $12,360 | $45,230 |
| 2014 | $2,647 | $57,590 | $12,360 | $45,230 |
Source: Public Records
Map
Nearby Homes
- 1395 Brookstone Dr
- 1281 Whitetail Dr
- 1105 Windsong Trail
- 3488 Byron Rd
- 1788 Fawnwood Ct
- 1878 Spring Meadows Dr
- 00 Trebein Rd
- 1088 Brehm Blvd
- Lot 1 Trebein Rd
- 1309 Candlelite Ln
- 1506 Indigo Dr
- 631 Westwood Dr
- 1101 Arden Way
- 2719 Golden Leaf Dr Unit 18-201
- 630 Hidden Valley Ct
- DaVinci Plan at Arden Place - Maple Street Collection
- Danville Plan at Arden Place - Maple Street Collection
- Denali Plan at Arden Place - Maple Street Collection
- Jensen Plan at Arden Place - Maple Street Collection
- Breckenridge Plan at Arden Place - Maple Street Collection
- 2303 Weston Dr
- 2317 Weston Dr
- 1424 Guardian Ct
- 1427 Guardian Ct
- 2325 Weston Dr
- 2295 Weston Dr
- 2308 Weston Dr
- 2316 Weston Dr
- 2300 Weston Dr
- 1431 Observatory Dr
- 1418 Guardian Ct
- 1419 Guardian Ct
- 2289 Weston Dr
- 2333 Weston Dr
- 1429 Observatory Dr
- 2294 Weston Dr
- 1449 Observatory Dr
- 1425 Observatory Dr
- 1406 Brookstone Dr
- 2288 Weston Dr