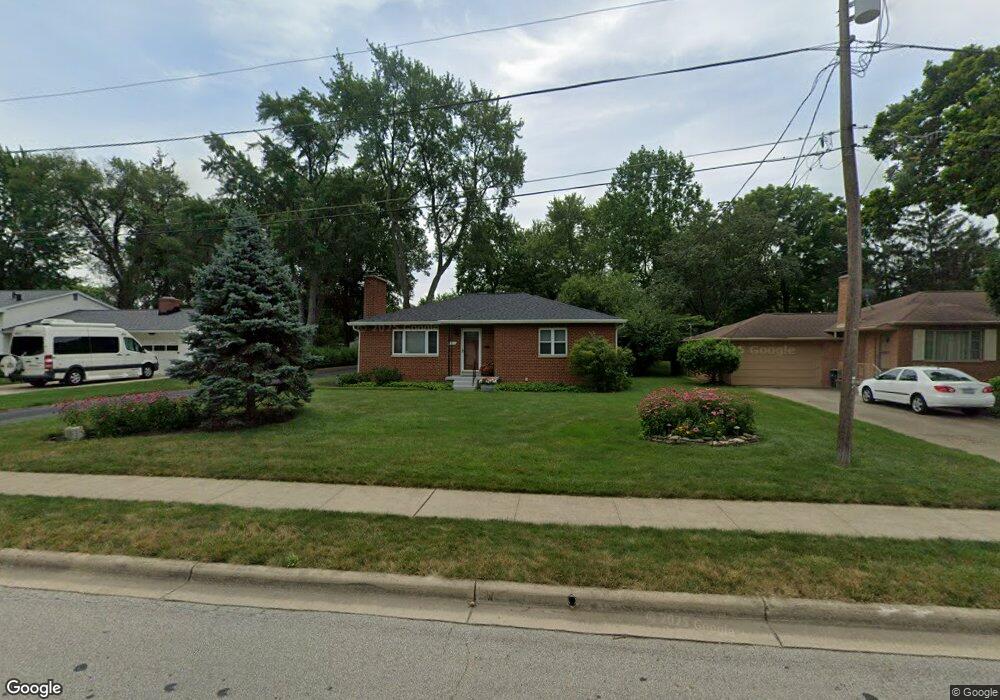
2311 Wickliffe Rd Columbus, OH 43221
Estimated Value: $402,000 - $557,125
3
Beds
2
Baths
1,344
Sq Ft
$360/Sq Ft
Est. Value
About This Home
This home is located at 2311 Wickliffe Rd, Columbus, OH 43221 and is currently estimated at $484,031, approximately $360 per square foot. 2311 Wickliffe Rd is a home located in Franklin County with nearby schools including Tremont Elementary School, Jones Middle School, and Upper Arlington High School.
Ownership History
Date
Name
Owned For
Owner Type
Purchase Details
Closed on
Oct 31, 2003
Sold by
Winner Jason W and Winner Michelle K
Bought by
Macblane Earl R and Macblane Patricia
Current Estimated Value
Home Financials for this Owner
Home Financials are based on the most recent Mortgage that was taken out on this home.
Original Mortgage
$158,000
Outstanding Balance
$84,358
Interest Rate
8.75%
Mortgage Type
Purchase Money Mortgage
Estimated Equity
$399,673
Purchase Details
Closed on
Jul 28, 2000
Sold by
Cecil William L and Cecil Judy L
Bought by
Winner Jason W and Winner Michelle K
Home Financials for this Owner
Home Financials are based on the most recent Mortgage that was taken out on this home.
Original Mortgage
$108,320
Interest Rate
8.19%
Purchase Details
Closed on
Sep 3, 1974
Bought by
Cecil Ii William L
Create a Home Valuation Report for This Property
The Home Valuation Report is an in-depth analysis detailing your home's value as well as a comparison with similar homes in the area
Home Values in the Area
Average Home Value in this Area
Purchase History
| Date | Buyer | Sale Price | Title Company |
|---|---|---|---|
| Macblane Earl R | $185,900 | Chicago Title | |
| Winner Jason W | $135,400 | Chicago Title | |
| Cecil Ii William L | -- | -- |
Source: Public Records
Mortgage History
| Date | Status | Borrower | Loan Amount |
|---|---|---|---|
| Open | Macblane Earl R | $158,000 | |
| Previous Owner | Winner Jason W | $108,320 |
Source: Public Records
Tax History
| Year | Tax Paid | Tax Assessment Tax Assessment Total Assessment is a certain percentage of the fair market value that is determined by local assessors to be the total taxable value of land and additions on the property. | Land | Improvement |
|---|---|---|---|---|
| 2025 | $8,715 | $150,540 | $71,190 | $79,350 |
| 2024 | $8,715 | $150,540 | $71,190 | $79,350 |
| 2023 | $8,607 | $150,535 | $71,190 | $79,345 |
| 2022 | $7,865 | $112,560 | $52,080 | $60,480 |
| 2021 | $6,963 | $112,560 | $52,080 | $60,480 |
| 2020 | $6,901 | $112,560 | $52,080 | $60,480 |
| 2019 | $6,789 | $97,900 | $52,080 | $45,820 |
| 2018 | $5,847 | $97,900 | $52,080 | $45,820 |
| 2017 | $5,842 | $97,900 | $52,080 | $45,820 |
| 2016 | $4,948 | $74,830 | $30,800 | $44,030 |
| 2015 | $4,943 | $74,830 | $30,800 | $44,030 |
| 2014 | $4,949 | $74,830 | $30,800 | $44,030 |
| 2013 | $2,364 | $68,040 | $28,000 | $40,040 |
Source: Public Records
Map
Nearby Homes
- 2375 Swansea Rd
- 2257 Swansea Rd
- 2390 Zollinger Rd
- 3134 Asbury Dr
- 3194 Mountview Rd
- 2227 Zollinger Rd
- 3134 Herrick Rd
- 3163 S Dorchester Rd
- 2480 Shrewsbury Rd
- 2979 Avalon Rd
- 2413 Edgevale Rd
- 2666 Woodstock Rd
- 2729 Eastcleft Dr
- 2458 Edgevale Rd
- 3106 Somerford Rd
- 1842 Ridgecliff Rd
- 1872 Kentwell Rd Unit 1872
- 2668 Edgevale Rd
- 2824 Chateau Cir S Unit 86
- 2861 Chateau Cir Unit 22
- 2301 Wickliffe Rd
- 2321 Wickliffe Rd
- 2331 Wickliffe Rd
- 2289 Wickliffe Rd
- 2324 Eastcleft Dr
- 2343 Wickliffe Rd
- 3271 Avalon Rd
- 2318 Eastcleft Dr
- 2332 Eastcleft Dr
- 2279 Wickliffe Rd
- 2348 Eastcleft Dr
- 3259 Avalon Rd
- 2308 Wickliffe Rd
- 2318 Wickliffe Rd
- 2298 Wickliffe Rd
- 3245 Avalon Rd
- 2357 Wickliffe Rd
- 2288 Wickliffe Rd
- 2356 Eastcleft Dr
- 2328 Wickliffe Rd
Your Personal Tour Guide
Ask me questions while you tour the home.