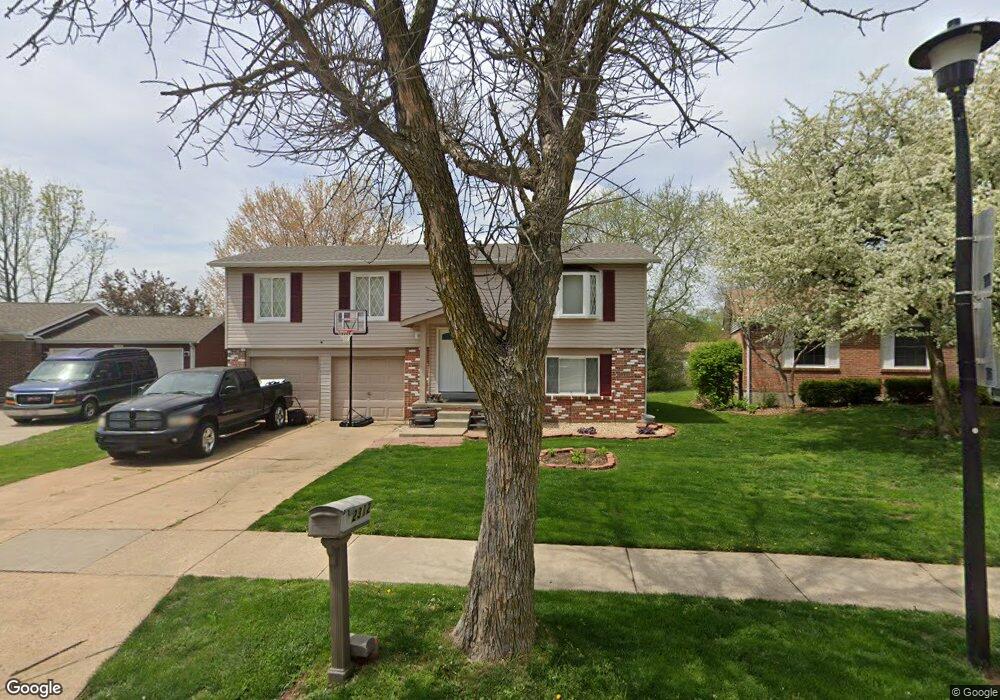
2312 Bensonhurst Dr Florissant, MO 63031
Estimated Value: $173,773 - $198,000
3
Beds
2
Baths
1,056
Sq Ft
$178/Sq Ft
Est. Value
About This Home
This home is located at 2312 Bensonhurst Dr, Florissant, MO 63031 and is currently estimated at $187,693, approximately $177 per square foot. 2312 Bensonhurst Dr is a home located in St. Louis County with nearby schools including Walker Elementary School, Northwest Middle School, and Hazelwood West High School.
Ownership History
Date
Name
Owned For
Owner Type
Purchase Details
Closed on
Mar 22, 2012
Sold by
Waterfall Victoria Mortgage Trust 2011-1
Bought by
Richardson Kristen P
Current Estimated Value
Home Financials for this Owner
Home Financials are based on the most recent Mortgage that was taken out on this home.
Original Mortgage
$72,124
Outstanding Balance
$50,131
Interest Rate
4.12%
Mortgage Type
FHA
Estimated Equity
$137,562
Purchase Details
Closed on
May 24, 2011
Sold by
Robinson Erica
Bought by
Waterfall Victoria Mortgage Trust 2011-1
Purchase Details
Closed on
May 19, 2006
Sold by
Jones Sharon A
Bought by
Robinson Erica
Home Financials for this Owner
Home Financials are based on the most recent Mortgage that was taken out on this home.
Original Mortgage
$108,000
Interest Rate
10.95%
Mortgage Type
Purchase Money Mortgage
Create a Home Valuation Report for This Property
The Home Valuation Report is an in-depth analysis detailing your home's value as well as a comparison with similar homes in the area
Home Values in the Area
Average Home Value in this Area
Purchase History
| Date | Buyer | Sale Price | Title Company |
|---|---|---|---|
| Richardson Kristen P | $74,000 | Linear Title & Closing Ltd | |
| Waterfall Victoria Mortgage Trust 2011-1 | $84,000 | None Available | |
| Robinson Erica | $135,000 | Davis Title & Abstract Co |
Source: Public Records
Mortgage History
| Date | Status | Borrower | Loan Amount |
|---|---|---|---|
| Open | Richardson Kristen P | $72,124 | |
| Previous Owner | Robinson Erica | $108,000 | |
| Closed | Waterfall Victoria Mortgage Trust 2011-1 | $0 |
Source: Public Records
Tax History Compared to Growth
Tax History
| Year | Tax Paid | Tax Assessment Tax Assessment Total Assessment is a certain percentage of the fair market value that is determined by local assessors to be the total taxable value of land and additions on the property. | Land | Improvement |
|---|---|---|---|---|
| 2025 | $2,340 | $36,030 | $5,530 | $30,500 |
| 2024 | $2,340 | $26,730 | $3,170 | $23,560 |
| 2023 | $2,336 | $26,730 | $3,170 | $23,560 |
| 2022 | $2,184 | $22,250 | $3,630 | $18,620 |
| 2021 | $2,152 | $22,250 | $3,630 | $18,620 |
| 2020 | $2,033 | $19,550 | $3,630 | $15,920 |
| 2019 | $2,002 | $19,550 | $3,630 | $15,920 |
| 2018 | $1,705 | $15,280 | $2,450 | $12,830 |
| 2017 | $1,703 | $15,280 | $2,450 | $12,830 |
| 2016 | $1,730 | $15,310 | $2,830 | $12,480 |
| 2015 | $1,693 | $15,310 | $2,830 | $12,480 |
| 2014 | $1,471 | $13,680 | $3,630 | $10,050 |
Source: Public Records
Map
Nearby Homes
- 2437 Periwinkle Ct
- 2235 Central Parkway Dr
- 2618 Freemantle Dr
- 2347 Farflung Dr
- 2042 Farflung Dr
- 2106 Kingsford Dr
- 1834 Night Dr
- 2314 Stoney End Ct
- 2112 Millvalley Dr
- 2216 Foggy Bottom Dr
- 1907 High Sun Dr
- 1885 High Sun Dr
- 1920 High Sun Dr
- 2515 Flamingo Dr
- 1863 High Sun Dr Unit 51863
- 2112 New Sun Dr
- 1831 New Sun Ct Unit 5
- 1830 New Sun Ct
- 2048 New Sun Dr
- 1920 Shackelford Rd
- 2308 Bensonhurst Dr
- 2316 Bensonhurst Dr
- 2304 Bensonhurst Dr
- 2320 Bensonhurst Dr
- 2311 Bensonhurst Dr
- 2526 Millvalley Dr
- 2522 Millvalley Dr
- 2530 Millvalley Dr
- 2275 White Ash Ct
- 2518 Millvalley Dr
- 2300 Bensonhurst Dr
- 2265 White Ash Ct
- 2324 Bensonhurst Dr
- 2321 Bensonhurst Dr
- 2303 Bensonhurst Dr
- 2285 White Ash Ct
- 2534 Millvalley Dr
- 2255 White Ash Ct
- 2296 Bensonhurst Dr
- 2508 Millvalley Dr