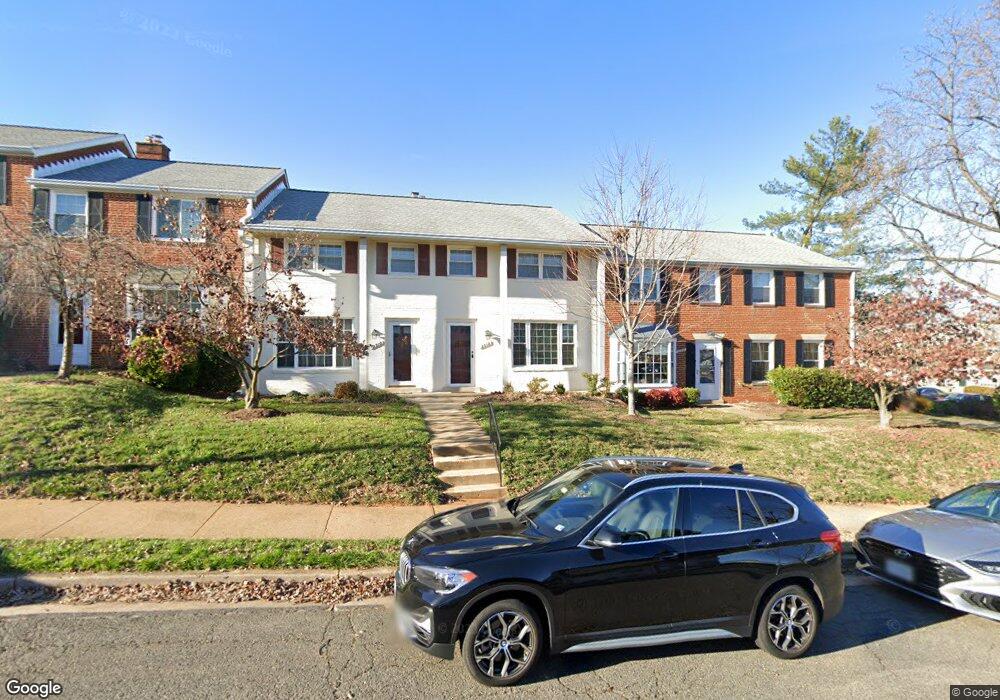
2312 N Dearing St Unit 226 Alexandria, VA 22302
Fairlington NeighborhoodEstimated Value: $502,532 - $526,000
2
Beds
2
Baths
1,010
Sq Ft
$507/Sq Ft
Est. Value
About This Home
This home is located at 2312 N Dearing St Unit 226, Alexandria, VA 22302 and is currently estimated at $511,844, approximately $506 per square foot. 2312 N Dearing St Unit 226 is a home located in Alexandria City with nearby schools including Douglas Macarthur Elementary School, George Washington Middle School, and Alexandria City High School.
Ownership History
Date
Name
Owned For
Owner Type
Purchase Details
Closed on
Jun 8, 2022
Sold by
Rys William A
Bought by
Moore Michael and Bruton Jessica
Current Estimated Value
Home Financials for this Owner
Home Financials are based on the most recent Mortgage that was taken out on this home.
Original Mortgage
$419,000
Outstanding Balance
$398,085
Interest Rate
5.1%
Mortgage Type
VA
Estimated Equity
$113,759
Purchase Details
Closed on
Aug 31, 2010
Sold by
Fissel Sandra L
Bought by
Rys William A
Home Financials for this Owner
Home Financials are based on the most recent Mortgage that was taken out on this home.
Original Mortgage
$293,250
Interest Rate
4.55%
Mortgage Type
New Conventional
Create a Home Valuation Report for This Property
The Home Valuation Report is an in-depth analysis detailing your home's value as well as a comparison with similar homes in the area
Home Values in the Area
Average Home Value in this Area
Purchase History
| Date | Buyer | Sale Price | Title Company |
|---|---|---|---|
| Moore Michael | $479,000 | First American Title | |
| Rys William A | $345,000 | -- |
Source: Public Records
Mortgage History
| Date | Status | Borrower | Loan Amount |
|---|---|---|---|
| Open | Moore Michael | $419,000 | |
| Previous Owner | Rys William A | $293,250 |
Source: Public Records
Tax History Compared to Growth
Tax History
| Year | Tax Paid | Tax Assessment Tax Assessment Total Assessment is a certain percentage of the fair market value that is determined by local assessors to be the total taxable value of land and additions on the property. | Land | Improvement |
|---|---|---|---|---|
| 2025 | $5,426 | $498,444 | $166,299 | $332,145 |
| 2024 | $5,426 | $470,230 | $156,886 | $313,344 |
| 2023 | $5,220 | $470,230 | $156,886 | $313,344 |
| 2022 | $5,220 | $470,230 | $156,886 | $313,344 |
| 2021 | $4,947 | $445,716 | $148,707 | $297,009 |
| 2020 | $4,603 | $416,557 | $138,979 | $277,578 |
| 2019 | $4,420 | $391,132 | $130,496 | $260,636 |
| 2018 | $4,333 | $383,463 | $127,937 | $255,526 |
| 2017 | $4,207 | $372,294 | $124,211 | $248,083 |
| 2016 | $3,995 | $372,294 | $124,211 | $248,083 |
| 2015 | $3,883 | $372,294 | $124,211 | $248,083 |
| 2014 | $3,698 | $354,566 | $118,296 | $236,270 |
Source: Public Records
Map
Nearby Homes
- 3823 Jay Ave
- 3827 Keller Ave
- 3755 Keller Ave
- 3818 King St
- 4437 36th St S Unit B2
- 3614 S Taylor St Unit 1450
- 3614 S Taylor St
- 4698 36th St S Unit A
- 3432 S Wakefield St Unit B1
- 2500 N Van Dorn St Unit 817
- 2500 N Van Dorn St Unit 316
- 2500 N Van Dorn St Unit 1118
- 2500 N Van Dorn St Unit 213
- 2500 N Van Dorn St Unit 517
- 2500 N Van Dorn St Unit 406
- 2500 N Van Dorn St Unit 1002
- 2500 N Van Dorn St Unit 1226
- 2500 N Van Dorn St Unit 1518
- 2500 N Van Dorn St Unit 912
- 4212 36th St S Unit A1
- 2312 N Dearing St
- 2316 N Dearing St
- 2316 N Dearing St Unit 228
- 2310 N Dearing St
- 2308 N Dearing St
- 2310 N Dearing St Unit 225
- 2306 N Dearing St
- 2306 N Dearing St Unit 223
- 3810 Jason Ave
- 3810 Jason Ave Unit 229
- 3812 Jason Ave
- 3812 Jason Ave Unit 230
- 3813 Jay Ave
- 3814 Jason Ave
- 3815 Jay Ave
- 3821 Jay Ave
- 3821 Jay Ave Unit 218
- 3817 Jay Ave Unit 220
- 3816 Jason Ave Unit 232
- 3819 Jay Ave