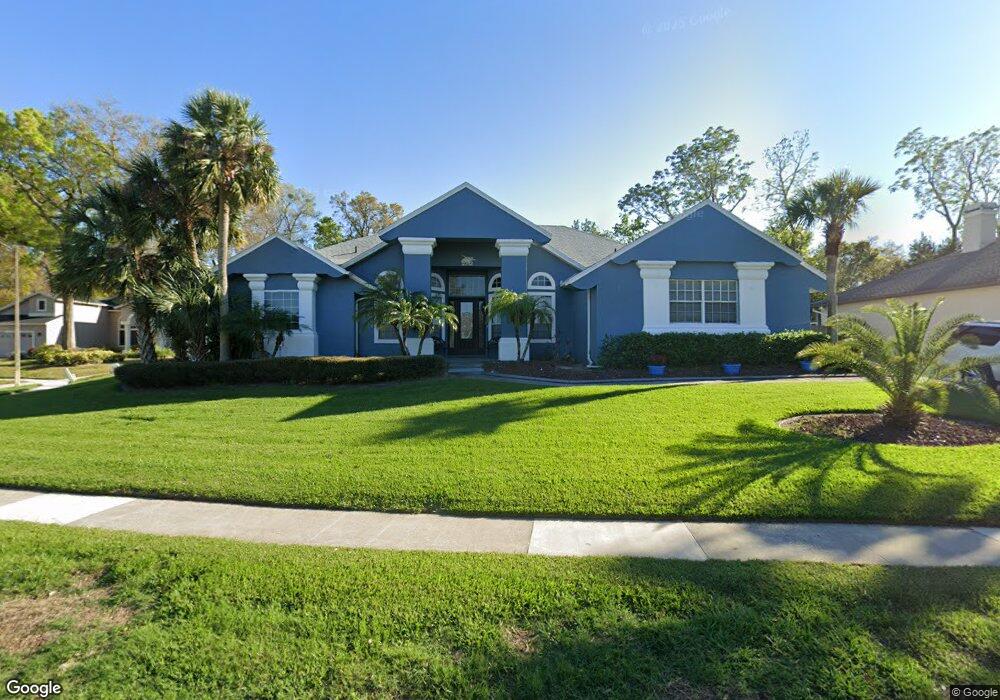
2312 Ridgeside Rd Apopka, FL 32712
Estimated Value: $574,000 - $632,000
4
Beds
3
Baths
3,852
Sq Ft
$156/Sq Ft
Est. Value
About This Home
This home is located at 2312 Ridgeside Rd, Apopka, FL 32712 and is currently estimated at $602,000, approximately $156 per square foot. 2312 Ridgeside Rd is a home located in Orange County with nearby schools including Clay Springs Elementary School, Piedmont Lakes Middle School, and Wekiva High School.
Ownership History
Date
Name
Owned For
Owner Type
Purchase Details
Closed on
Dec 31, 2010
Sold by
Us Bank National Association
Bought by
Gryl Cory A and Gryl Janeen M
Current Estimated Value
Home Financials for this Owner
Home Financials are based on the most recent Mortgage that was taken out on this home.
Original Mortgage
$191,499
Interest Rate
4.66%
Mortgage Type
FHA
Purchase Details
Closed on
Aug 10, 2010
Sold by
Whitehead Matthew J
Bought by
Us Bank National Association
Purchase Details
Closed on
Aug 5, 1997
Sold by
Jordan William L and Jordan Rochelle A
Bought by
Whitehead Matthew J
Purchase Details
Closed on
Jan 9, 1997
Sold by
Sears Joseph J
Bought by
Jordan William L and Jordan Rochelle A
Home Financials for this Owner
Home Financials are based on the most recent Mortgage that was taken out on this home.
Original Mortgage
$188,000
Interest Rate
7.53%
Mortgage Type
VA
Create a Home Valuation Report for This Property
The Home Valuation Report is an in-depth analysis detailing your home's value as well as a comparison with similar homes in the area
Home Values in the Area
Average Home Value in this Area
Purchase History
| Date | Buyer | Sale Price | Title Company |
|---|---|---|---|
| Gryl Cory A | $196,500 | Rels Title | |
| Us Bank National Association | -- | None Available | |
| Whitehead Matthew J | $196,100 | -- | |
| Jordan William L | $188,000 | -- |
Source: Public Records
Mortgage History
| Date | Status | Borrower | Loan Amount |
|---|---|---|---|
| Previous Owner | Gryl Cory A | $191,499 | |
| Previous Owner | Jordan William L | $188,000 |
Source: Public Records
Tax History Compared to Growth
Tax History
| Year | Tax Paid | Tax Assessment Tax Assessment Total Assessment is a certain percentage of the fair market value that is determined by local assessors to be the total taxable value of land and additions on the property. | Land | Improvement |
|---|---|---|---|---|
| 2025 | $3,384 | $227,395 | -- | -- |
| 2024 | $3,134 | $227,395 | -- | -- |
| 2023 | $3,134 | $212,608 | $0 | $0 |
| 2022 | $3,008 | $206,416 | $0 | $0 |
| 2021 | $2,956 | $200,404 | $0 | $0 |
| 2020 | $2,805 | $197,637 | $0 | $0 |
| 2019 | $2,880 | $193,194 | $0 | $0 |
| 2018 | $2,843 | $189,592 | $0 | $0 |
| 2017 | $2,792 | $291,286 | $50,000 | $241,286 |
| 2016 | $2,762 | $269,455 | $50,000 | $219,455 |
| 2015 | $2,805 | $242,582 | $50,000 | $192,582 |
| 2014 | $2,850 | $209,523 | $50,000 | $159,523 |
Source: Public Records
Map
Nearby Homes
- 2226 Orchard Dr
- 1036 Golf Valley Dr
- 2219 Bigler Oak Place
- 718 N Wekiwa Springs Rd
- 0 Majestic Oak Dr
- 2744 Orchard Dr
- 2132 Palm Vista Dr
- 2434 Carol Woods Way
- 1225 Majestic Palm Ct
- 538 Majestic Oak Dr
- 2320 Wekiva Ridge Rd
- 2446 Sweetwater Country Club Dr
- 2470 Sweetwater Country Club Dr
- 1204 Duncan Ct
- 1902 Palm View Dr
- 2515 Sweetwater Country Club Dr
- 201 Lyndhurst Ct
- 3046 Falconhill Dr
- 1445 Valley Pine Cir
- 3119 Falconhill Dr
- 2306 Ridgeside Rd
- 2318 Ridgeside Rd
- 2324 Ridgeside Rd
- 908 Ridge Spring Ct
- 2313 Ridgeside Rd
- 2300 Ridgeside Rd
- 2307 Ridgeside Rd
- 2330 Ridgeside Rd
- 2309 Sweetwater Cc Place Dr
- 2317 Sweetwater Cc Place Dr
- 843 N Wekiwa Springs Rd
- 2331 Ridgeside Rd
- 914 Ridge Spring Ct
- 2325 Sweetwater Cc Place Dr
- 2301 Ridgeside Rd
- 2336 Ridgeside Rd
- 2333 Sweetwater Cc Place Dr
- 920 Ridge Spring Ct
- 2405 Ridgeside Rd
- 913 Ridge Spring Ct