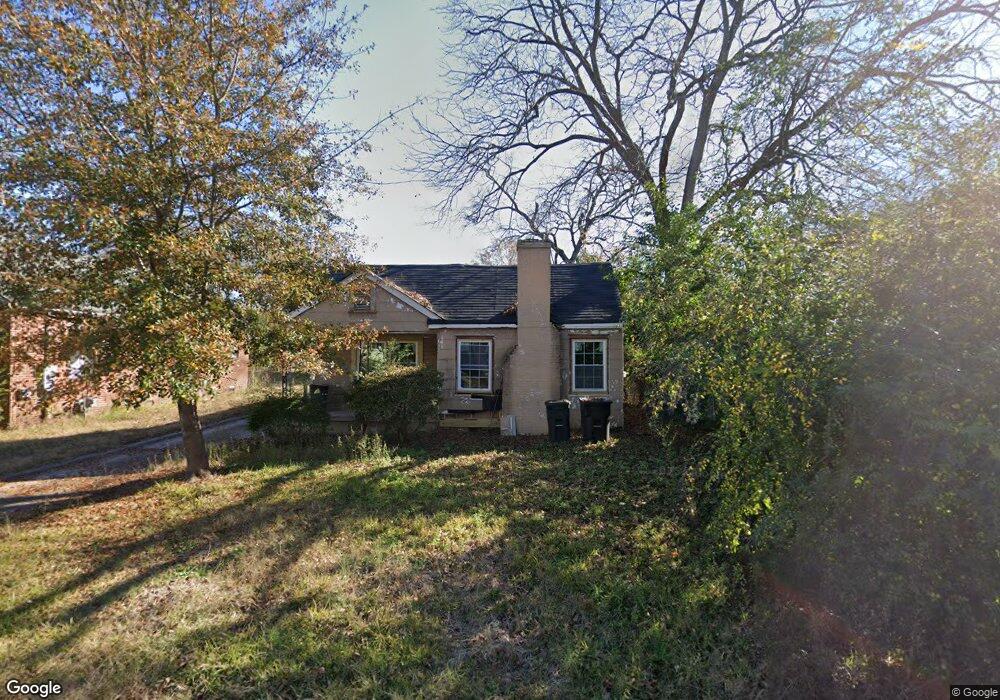
2312 Schaul St Columbus, GA 31906
East Wynnton-Wynnton Hill NeighborhoodEstimated Value: $55,060 - $89,000
2
Beds
3
Baths
848
Sq Ft
$83/Sq Ft
Est. Value
About This Home
This home is located at 2312 Schaul St, Columbus, GA 31906 and is currently estimated at $70,515, approximately $83 per square foot. 2312 Schaul St is a home located in Muscogee County with nearby schools including Rigdon Road Elementary School, Baker Middle School, and Carver High School.
Ownership History
Date
Name
Owned For
Owner Type
Purchase Details
Closed on
Dec 29, 2016
Sold by
Not Provided
Bought by
Kirven Phillip E
Current Estimated Value
Purchase Details
Closed on
Jan 27, 2016
Sold by
Jr Construction Inc
Bought by
Powers Investments Llc
Purchase Details
Closed on
Jan 14, 2016
Sold by
Old Boyz Investments Llc
Bought by
Jr Construction Inc
Purchase Details
Closed on
Nov 13, 2014
Sold by
4903 Llc
Bought by
Old Boyz Investments Llc
Purchase Details
Closed on
Sep 2, 2014
Sold by
Thornton Andy M
Bought by
4903 Llc
Create a Home Valuation Report for This Property
The Home Valuation Report is an in-depth analysis detailing your home's value as well as a comparison with similar homes in the area
Home Values in the Area
Average Home Value in this Area
Purchase History
| Date | Buyer | Sale Price | Title Company |
|---|---|---|---|
| Kirven Phillip E | $58,000 | -- | |
| Powers Investments Llc | $10,000 | -- | |
| Jr Construction Inc | $4,500 | -- | |
| Old Boyz Investments Llc | $1,600 | -- | |
| Old Boyz Investments Llc | $1,600 | -- | |
| 4903 Llc | $908 | -- |
Source: Public Records
Tax History Compared to Growth
Tax History
| Year | Tax Paid | Tax Assessment Tax Assessment Total Assessment is a certain percentage of the fair market value that is determined by local assessors to be the total taxable value of land and additions on the property. | Land | Improvement |
|---|---|---|---|---|
| 2025 | $773 | $19,756 | $4,080 | $15,676 |
| 2024 | $773 | $19,756 | $4,080 | $15,676 |
| 2023 | $778 | $19,756 | $4,080 | $15,676 |
| 2022 | $254 | $6,224 | $4,080 | $2,144 |
| 2021 | $303 | $6,648 | $4,080 | $2,568 |
| 2020 | $272 | $6,648 | $4,080 | $2,568 |
| 2019 | $272 | $6,648 | $4,080 | $2,568 |
| 2018 | $272 | $6,648 | $4,080 | $2,568 |
| 2017 | $187 | $4,000 | $1,120 | $2,880 |
| 2016 | $215 | $5,201 | $1,930 | $3,271 |
| 2015 | $177 | $10,738 | $1,930 | $8,808 |
| 2014 | $439 | $10,607 | $1,930 | $8,677 |
| 2013 | -- | $10,607 | $1,930 | $8,677 |
Source: Public Records
Map
Nearby Homes
- 2312 Marion St
- 2229 10th St
- 1033 Britt Ave
- 2400 Bell St
- 2429 Bell St
- 2114 George St
- 1054 Lawyers Ln
- 1227 Forest Ave Unit 4
- 2205 Willard St
- 1164 Tate Dr
- 2717 10th St
- 2211 8th St
- 2113 8th St
- 2133 13th St
- 2125 13th St Unit 12
- 2726 Marion St
- 1319 Hilton Ave
- 745 Brown Ave
- 752 Portland Ave
- 2717 Baldwin St