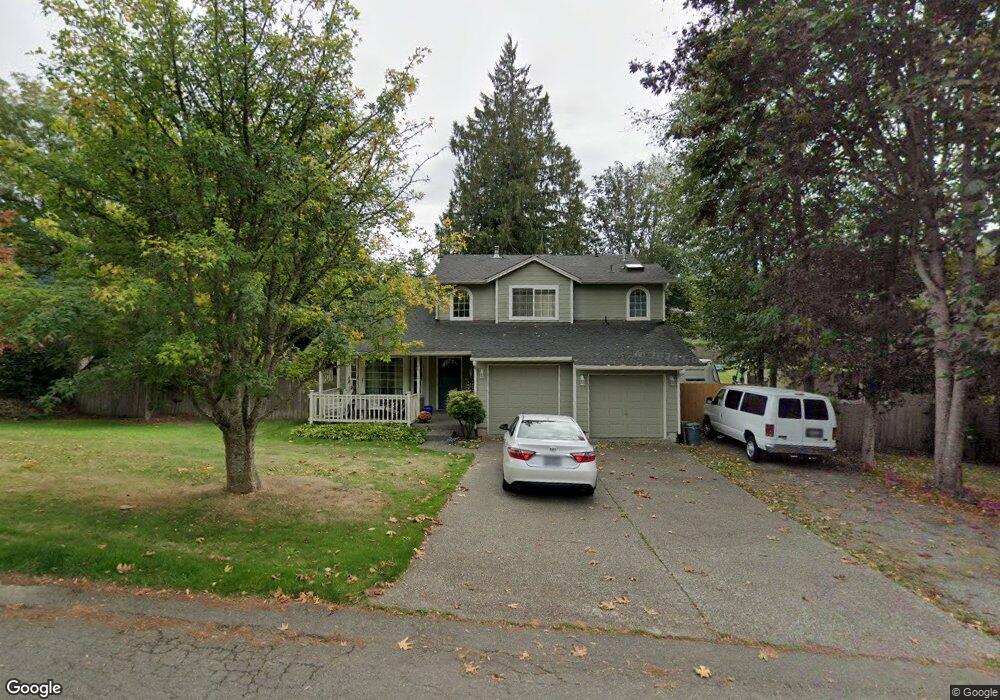
2312 Steamboat Loop E Port Orchard, WA 98366
Parkwood NeighborhoodEstimated Value: $595,814 - $664,000
3
Beds
3
Baths
1,909
Sq Ft
$325/Sq Ft
Est. Value
About This Home
This home is located at 2312 Steamboat Loop E, Port Orchard, WA 98366 and is currently estimated at $620,954, approximately $325 per square foot. 2312 Steamboat Loop E is a home located in Kitsap County with nearby schools including Orchard Heights Elementary School, Marcus Whitman Middle School, and South Kitsap High School.
Ownership History
Date
Name
Owned For
Owner Type
Purchase Details
Closed on
Feb 1, 2012
Sold by
Moore David A
Bought by
Farmen Ken C and Farmen Julie E
Current Estimated Value
Home Financials for this Owner
Home Financials are based on the most recent Mortgage that was taken out on this home.
Original Mortgage
$235,865
Outstanding Balance
$160,503
Interest Rate
3.75%
Mortgage Type
FHA
Estimated Equity
$460,451
Purchase Details
Closed on
Jan 26, 2011
Sold by
Estate Of Susan Moore and Moore David A
Bought by
Moore David A
Purchase Details
Closed on
Nov 17, 2004
Sold by
Jahns Scott A and Holland Catherine E
Bought by
Moore Susan
Purchase Details
Closed on
Nov 16, 2004
Sold by
Moore David Arthur
Bought by
Moore Susan
Purchase Details
Closed on
Jul 7, 2000
Sold by
Yee Construction Corp
Bought by
Holland Catherine E and Jahns Scott A
Home Financials for this Owner
Home Financials are based on the most recent Mortgage that was taken out on this home.
Original Mortgage
$144,000
Interest Rate
8.55%
Purchase Details
Closed on
Jan 21, 2000
Sold by
First Community Bank Of Washington
Bought by
Yee Construction Corp
Create a Home Valuation Report for This Property
The Home Valuation Report is an in-depth analysis detailing your home's value as well as a comparison with similar homes in the area
Home Values in the Area
Average Home Value in this Area
Purchase History
| Date | Buyer | Sale Price | Title Company |
|---|---|---|---|
| Farmen Ken C | $242,280 | Pacific Nw Title | |
| Moore David A | -- | None Available | |
| Moore Susan | $230,000 | Transnation Title | |
| Moore Susan | -- | Transnation Title | |
| Holland Catherine E | $160,000 | Land Title Company | |
| Yee Construction Corp | $26,950 | Land Title Company |
Source: Public Records
Mortgage History
| Date | Status | Borrower | Loan Amount |
|---|---|---|---|
| Open | Farmen Ken C | $235,865 | |
| Previous Owner | Holland Catherine E | $144,000 |
Source: Public Records
Tax History
| Year | Tax Paid | Tax Assessment Tax Assessment Total Assessment is a certain percentage of the fair market value that is determined by local assessors to be the total taxable value of land and additions on the property. | Land | Improvement |
|---|---|---|---|---|
| 2026 | $4,452 | $519,470 | $92,600 | $426,870 |
| 2025 | $4,452 | $508,340 | $77,000 | $431,340 |
| 2024 | $4,317 | $508,340 | $77,000 | $431,340 |
| 2023 | $4,289 | $508,340 | $77,000 | $431,340 |
| 2022 | $4,212 | $418,320 | $71,910 | $346,410 |
| 2021 | $4,117 | $387,010 | $66,820 | $320,190 |
| 2020 | $4,038 | $368,780 | $63,640 | $305,140 |
| 2019 | $3,376 | $337,860 | $62,680 | $275,180 |
| 2018 | $3,521 | $272,100 | $62,680 | $209,420 |
| 2017 | $2,999 | $272,100 | $62,680 | $209,420 |
| 2016 | $2,696 | $223,230 | $62,680 | $160,550 |
| 2015 | $2,606 | $218,590 | $62,680 | $155,910 |
| 2014 | -- | $215,510 | $62,680 | $152,830 |
| 2013 | -- | $224,900 | $65,980 | $158,920 |
Source: Public Records
Map
Nearby Homes
- 758 Tufts Ave E
- 3523 E Calistoga Ct
- 3140 E Washington St
- 683 SE Olga Cir
- 4238 SE Horsehead Way
- 0 Rama Dr E Unit NWM2493377
- 784 Freedom Ct SE
- 4048 SE Horstman Rd
- 3130 SE Horstman Rd
- 0 Beach Dr E Unit NWM2139946
- 0 Beach Dr E Unit NWM2472511
- 4484 SE Foss Rd
- 1283 Etna Place SE
- 4798 E Stable Ln
- 0 Wendell Ave SE
- 4269 SE Elijah Ct
- 123 E 4th St
- 1663 Harrison Ave SE
- 2515 Williams Ln
- 2949 SE Mile Hill Dr Unit C7
- 2318 Steamboat Loop E
- 2306 Steamboat Loop E
- 2294 Steamboat Loop E
- 2324 Steamboat Loop E
- 2300 Steamboat Loop E
- 2283 Steamboat E Lot#18 Loop
- 2300 Steamboat Loop E
- 2301 Steamboat Loop E
- 2288 Steamboat Loop E
- 2336 Steamboat Loop E
- 2307 Steamboat Loop E
- 2295 Steamboat Loop E
- 2330 Steamboat Loop E
- 2325 Steamboat Loop E
- 2283 Steamboat Loop E
- 2247 Steamboat Loop E
- 2259 Steamboat Loop E
- 2259 Steamboat Loop E
- 2282 Steamboat Loop E
- 1272 Lidstrom Rd E
Your Personal Tour Guide
Ask me questions while you tour the home.