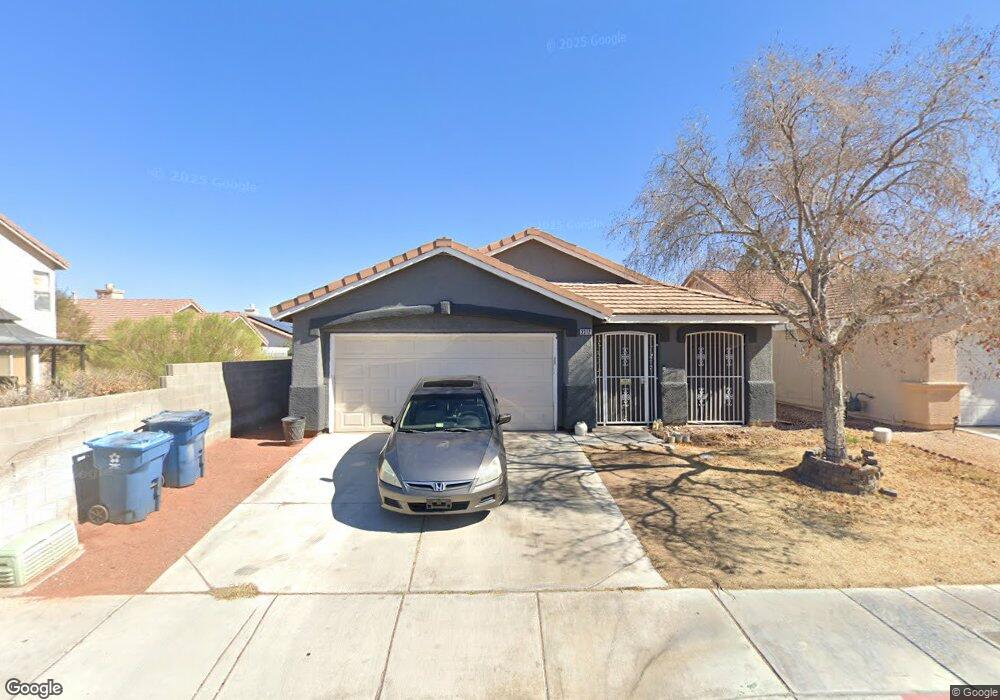
2312 Steinke Ln Las Vegas, NV 89108
Michael Way NeighborhoodEstimated Value: $379,202 - $427,000
3
Beds
2
Baths
1,315
Sq Ft
$307/Sq Ft
Est. Value
About This Home
This home is located at 2312 Steinke Ln, Las Vegas, NV 89108 and is currently estimated at $403,301, approximately $306 per square foot. 2312 Steinke Ln is a home located in Clark County with nearby schools including Lilly & Wing Fong Elementary School, J. Harold Brinley Middle School, and Cimarron Memorial High School.
Ownership History
Date
Name
Owned For
Owner Type
Purchase Details
Closed on
May 2, 2023
Sold by
Williams Marsallias L
Bought by
Mlw Trust and Williams
Current Estimated Value
Purchase Details
Closed on
Nov 24, 2004
Sold by
Williams Marallias and Williams Marallias L
Bought by
Williams Marallias
Home Financials for this Owner
Home Financials are based on the most recent Mortgage that was taken out on this home.
Original Mortgage
$119,942
Interest Rate
5.74%
Mortgage Type
FHA
Purchase Details
Closed on
Dec 30, 1998
Sold by
Esse David J
Bought by
Williams Marsallias L
Home Financials for this Owner
Home Financials are based on the most recent Mortgage that was taken out on this home.
Original Mortgage
$123,366
Interest Rate
6.82%
Mortgage Type
FHA
Purchase Details
Closed on
Dec 18, 1996
Sold by
Kaufman & Broad Of Nevada Inc
Bought by
Esse David J
Home Financials for this Owner
Home Financials are based on the most recent Mortgage that was taken out on this home.
Original Mortgage
$114,683
Interest Rate
7.86%
Mortgage Type
FHA
Create a Home Valuation Report for This Property
The Home Valuation Report is an in-depth analysis detailing your home's value as well as a comparison with similar homes in the area
Home Values in the Area
Average Home Value in this Area
Purchase History
| Date | Buyer | Sale Price | Title Company |
|---|---|---|---|
| Mlw Trust | -- | None Listed On Document | |
| Williams Marallias | -- | Chicago Title | |
| Williams Marsallias L | $126,000 | Nevada Title Company | |
| Esse David J | $116,500 | United Title |
Source: Public Records
Mortgage History
| Date | Status | Borrower | Loan Amount |
|---|---|---|---|
| Previous Owner | Williams Marallias | $119,942 | |
| Previous Owner | Williams Marsallias L | $123,366 | |
| Previous Owner | Esse David J | $114,683 |
Source: Public Records
Tax History Compared to Growth
Tax History
| Year | Tax Paid | Tax Assessment Tax Assessment Total Assessment is a certain percentage of the fair market value that is determined by local assessors to be the total taxable value of land and additions on the property. | Land | Improvement |
|---|---|---|---|---|
| 2025 | $1,375 | $80,486 | $27,300 | $53,186 |
| 2024 | $1,336 | $80,486 | $27,300 | $53,186 |
| 2023 | $1,327 | $79,095 | $28,700 | $50,395 |
| 2022 | $1,297 | $70,759 | $24,500 | $46,259 |
| 2021 | $1,259 | $65,383 | $21,350 | $44,033 |
| 2020 | $1,219 | $63,666 | $19,950 | $43,716 |
| 2019 | $1,205 | $61,036 | $17,850 | $43,186 |
| 2018 | $1,149 | $55,347 | $13,650 | $41,697 |
| 2017 | $1,777 | $54,214 | $11,900 | $42,314 |
| 2016 | $1,327 | $48,853 | $9,800 | $39,053 |
| 2015 | $1,321 | $39,526 | $8,050 | $31,476 |
| 2014 | $1,355 | $31,428 | $4,900 | $26,528 |
Source: Public Records
Map
Nearby Homes
- 2308 Avery Dr
- 6557 Sweetzer Way
- 2201 James Bilbray Dr
- 6577 Goldensun Ct
- 2136 Bavington Dr Unit A
- 2248 Short Pine Dr
- 2140 Bavington Dr Unit B
- 2204 Short Pine Dr
- 6544 Gumwood Rd
- 6465 Big Pine Way
- 2451 N Rainbow Blvd Unit 1019
- 2451 N Rainbow Blvd Unit 2004
- 2451 N Rainbow Blvd Unit 1123
- 2451 N Rainbow Blvd Unit 2073
- 2451 N Rainbow Blvd Unit 1083
- 2451 N Rainbow Blvd Unit 2048
- 2451 N Rainbow Blvd Unit 1047
- 2451 N Rainbow Blvd Unit 1084
- 2451 N Rainbow Blvd Unit 1137
- 2451 N Rainbow Blvd Unit 1095
- 2308 Steinke Ln
- 2308 Steinke Ln Unit n/a
- 6585 Sweetzer Way
- 6589 Sweetzer Way
- 6589 Sweetzer Way Unit n/a
- 6581 Sweetzer Way
- 2304 Steinke Ln
- 2309 Avery Dr
- 2313 Avery Dr
- 6577 Sweetzer Way
- 6600 Genevieve Ct
- 2300 Steinke Ln
- 2305 Avery Dr
- 6601 Sweetzer Way
- 6573 Sweetzer Way
- 2301 Avery Dr
- 6604 Genevieve Ct Unit 3
- 2240 Steinke Ln Unit 4
- 2328 Steinke Ln
- 6605 Sweetzer Way