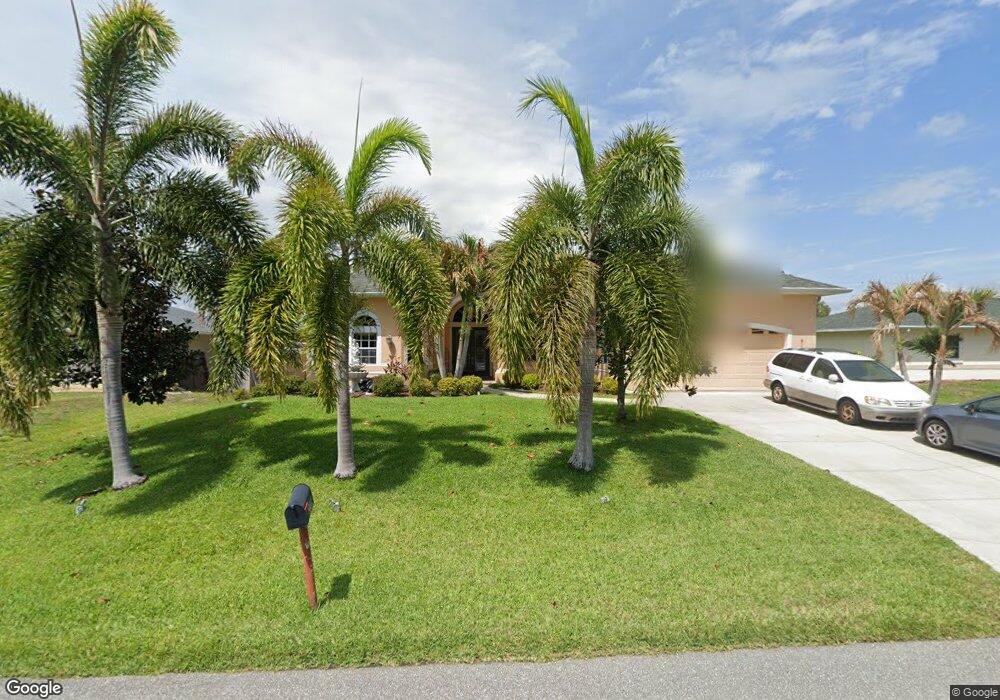
23120 Allen Ave Punta Gorda, FL 33980
Estimated Value: $355,000 - $469,000
3
Beds
2
Baths
2,759
Sq Ft
$146/Sq Ft
Est. Value
About This Home
This home is located at 23120 Allen Ave, Punta Gorda, FL 33980 and is currently estimated at $401,964, approximately $145 per square foot. 23120 Allen Ave is a home located in Charlotte County with nearby schools including Kingsway Elementary School, Port Charlotte Middle School, and Charlotte High School.
Ownership History
Date
Name
Owned For
Owner Type
Purchase Details
Closed on
Jul 19, 2024
Sold by
Barthelus Sherwood
Bought by
Barthelus Fenold
Current Estimated Value
Purchase Details
Closed on
Apr 4, 2022
Sold by
Barthelus and Claudette
Bought by
Barthelus Sherwood
Purchase Details
Closed on
Mar 21, 2022
Sold by
Barthelus and Claudette
Bought by
Barthelus Fenold
Purchase Details
Closed on
Apr 10, 2019
Sold by
Barthelus Fenold
Bought by
Barthelus Fenold and Barthelus Sherwood
Purchase Details
Closed on
Sep 14, 2007
Sold by
Barthelus Sainte H
Bought by
Barthelus Fenold
Purchase Details
Closed on
Dec 13, 2006
Sold by
Barthelus Fenold and Narcisse Odve
Bought by
Barthelus Fenold
Purchase Details
Closed on
Apr 6, 2005
Sold by
Barthelus Fenold and Barthelus Sainte
Bought by
Barthelus Fenold and Narcisse Odve
Purchase Details
Closed on
Dec 7, 2001
Sold by
Huber Robert H and Huber June E
Bought by
Barthelus Fenold and Barthelus Sainte
Create a Home Valuation Report for This Property
The Home Valuation Report is an in-depth analysis detailing your home's value as well as a comparison with similar homes in the area
Home Values in the Area
Average Home Value in this Area
Purchase History
| Date | Buyer | Sale Price | Title Company |
|---|---|---|---|
| Barthelus Fenold | $100 | None Listed On Document | |
| Barthelus Sherwood | -- | None Listed On Document | |
| Barthelus Fenold | -- | None Listed On Document | |
| Barthelus Fenold | -- | Attorney | |
| Barthelus Fenold | -- | Attorney | |
| Barthelus Fenold | -- | None Available | |
| Barthelus Fenold | -- | -- | |
| Barthelus Fenold | $2,500 | -- |
Source: Public Records
Tax History Compared to Growth
Tax History
| Year | Tax Paid | Tax Assessment Tax Assessment Total Assessment is a certain percentage of the fair market value that is determined by local assessors to be the total taxable value of land and additions on the property. | Land | Improvement |
|---|---|---|---|---|
| 2023 | $7,168 | $447,519 | $18,700 | $428,819 |
| 2022 | $4,903 | $305,027 | $0 | $0 |
| 2021 | $4,481 | $269,720 | $0 | $0 |
| 2020 | $4,280 | $257,861 | $0 | $0 |
| 2019 | $3,176 | $193,367 | $0 | $0 |
| 2018 | $2,936 | $189,762 | $0 | $0 |
| 2017 | $2,909 | $185,859 | $0 | $0 |
| 2016 | $2,895 | $182,036 | $0 | $0 |
| 2015 | $2,896 | $180,771 | $0 | $0 |
| 2014 | $2,866 | $179,336 | $0 | $0 |
Source: Public Records
Map
Nearby Homes
- 23088 Allen Ave
- 23103 Wilkinson Ave
- 23089 Brewer Ave
- 2543 Villa St
- 23120 Newcun Ave
- 23104 Rountree Ave
- 23188 Brad Ave
- 23320 Wicker Ave
- 23296 Wicker Ave
- 23065 Newcun Ave
- 23072 Gray Ave
- 23064 Gray Ave
- 23324 Airway Ave
- 23108 & 23116 Olean Blvd
- 3190 Leamington St
- 23155 MacLellan Ave
- 3272 Milwaukee St
- 23122 MacLellan Ave
- 23102 MacLellan Ave
- 23277 Wilber Ave
- 23128 Allen Ave
- 23112 Allen Ave
- 23119 Cherry Ave
- 23111 Cherry Ave
- 23127 Cherry Ave
- 23136 Allen Ave
- 23104 Allen Ave
- 23119 Allen Ave
- 23111 Allen Ave
- 23103 Cherry Ave
- 23135 Cherry Ave
- 23144 Allen Ave
- 23096 Allen Ave
- 23143 Allen Ave
- 23095 Cherry Ave
- 23143 Cherry Ave
- 23120 Cherry Ave
- 23112 Cherry Ave
- 23152 Allen Ave
- 23104 Cherry Ave