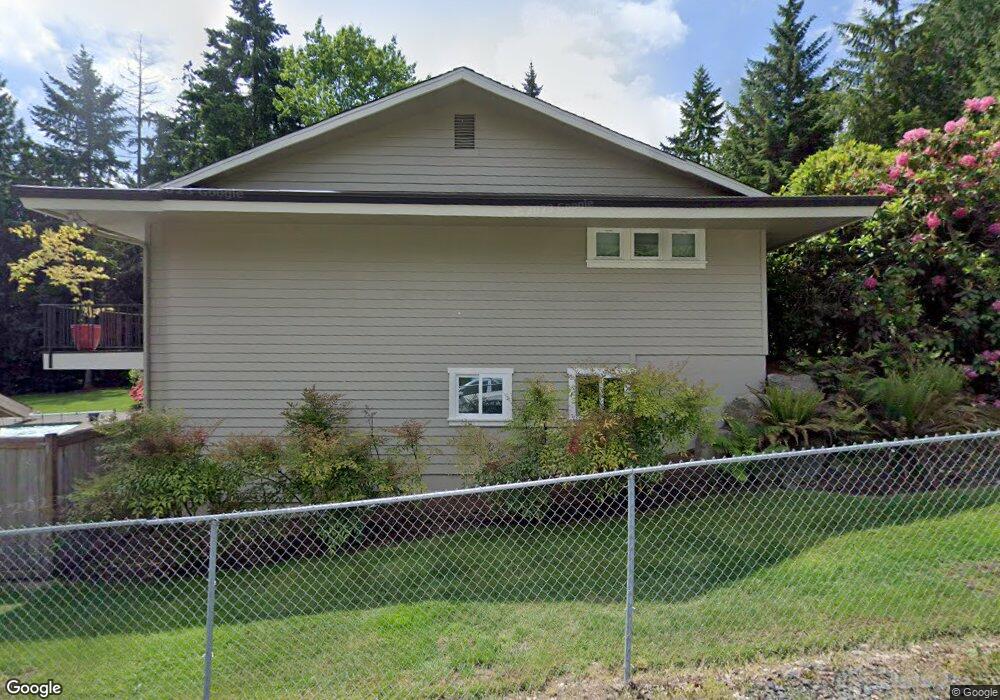
23121 3rd Ave SE Bothell, WA 98021
Queensborough-Brentwood NeighborhoodEstimated Value: $1,448,000 - $1,602,000
5
Beds
5
Baths
2,718
Sq Ft
$573/Sq Ft
Est. Value
About This Home
This home is located at 23121 3rd Ave SE, Bothell, WA 98021 and is currently estimated at $1,556,385, approximately $572 per square foot. 23121 3rd Ave SE is a home located in Snohomish County with nearby schools including Shelton View Elementary School, Canyon Park Junior High School, and Bothell High School.
Ownership History
Date
Name
Owned For
Owner Type
Purchase Details
Closed on
Nov 15, 2006
Sold by
Day Shosana
Bought by
Foley Bryon L and Foley Alison R O
Current Estimated Value
Home Financials for this Owner
Home Financials are based on the most recent Mortgage that was taken out on this home.
Original Mortgage
$580,000
Outstanding Balance
$333,601
Interest Rate
6.28%
Mortgage Type
Purchase Money Mortgage
Estimated Equity
$1,222,784
Purchase Details
Closed on
Dec 10, 2004
Sold by
Day Shawn
Bought by
Day Shosana
Home Financials for this Owner
Home Financials are based on the most recent Mortgage that was taken out on this home.
Original Mortgage
$51,500
Interest Rate
5.76%
Mortgage Type
Seller Take Back
Purchase Details
Closed on
Nov 29, 2000
Sold by
Hartvigson Arnold
Bought by
Day Shawn A and Day Shosana C
Home Financials for this Owner
Home Financials are based on the most recent Mortgage that was taken out on this home.
Original Mortgage
$393,100
Interest Rate
7.86%
Create a Home Valuation Report for This Property
The Home Valuation Report is an in-depth analysis detailing your home's value as well as a comparison with similar homes in the area
Home Values in the Area
Average Home Value in this Area
Purchase History
| Date | Buyer | Sale Price | Title Company |
|---|---|---|---|
| Foley Bryon L | $725,000 | Old Republic Title Ltd | |
| Day Shosana | $14,044 | -- | |
| Day Shawn A | $436,800 | Old Republic Title Ltd |
Source: Public Records
Mortgage History
| Date | Status | Borrower | Loan Amount |
|---|---|---|---|
| Open | Foley Bryon L | $580,000 | |
| Previous Owner | Day Shosana | $51,500 | |
| Previous Owner | Day Shawn A | $393,100 |
Source: Public Records
Tax History
| Year | Tax Paid | Tax Assessment Tax Assessment Total Assessment is a certain percentage of the fair market value that is determined by local assessors to be the total taxable value of land and additions on the property. | Land | Improvement |
|---|---|---|---|---|
| 2026 | $11,442 | $1,398,400 | $714,000 | $684,400 |
| 2025 | $10,397 | $1,381,800 | $714,000 | $667,800 |
| 2024 | $10,397 | $1,250,400 | $614,000 | $636,400 |
| 2023 | $11,047 | $1,452,300 | $714,000 | $738,300 |
| 2022 | $10,693 | $1,136,100 | $507,000 | $629,100 |
| 2020 | $9,816 | $967,000 | $407,000 | $560,000 |
| 2019 | $8,678 | $886,300 | $337,000 | $549,300 |
| 2018 | $8,225 | $810,100 | $312,700 | $497,400 |
| 2017 | $7,334 | $732,100 | $264,100 | $468,000 |
| 2016 | $6,799 | $701,400 | $249,900 | $451,500 |
| 2015 | $6,554 | $640,000 | $228,500 | $411,500 |
| 2013 | $5,758 | $494,300 | $164,200 | $330,100 |
Source: Public Records
Map
Nearby Homes
- 23022 7th Ave SE
- 100 228th St SE Unit 19B
- 18 232nd Place SW
- 22827 Meridian Ave S
- 29 232nd Place SW
- 815 236th St SE Unit C
- 815 236th St SE Unit F
- 815 236th St SE Unit E
- 815 236th St SE Unit B
- 815 236th St SE Unit D
- 815 236th St SE Unit A
- 23431 9th Ave SE Unit 30
- 22621 8th Dr SE
- 19924 7th Dr SE
- 20021 7th Dr SE
- 20027 7th Dr SE
- 610 237th Place SE Unit B
- 917 228th St SE
- 524 238th Place SE Unit C
- 24330 13 Ave SE Unit CR13
- 23205 3rd Ave SE
- 23103 3rd Ave SE
- 23107 3rd Ave SE
- 23209 3rd Ave SE
- 23111 3rd Ave SE
- 23220 3rd Ave SE
- 23100 3rd Ave SE
- 23025 3rd Ave SE
- 23126 3rd Ave SE
- 23225 3rd Ave SE
- 23128 3rd Ave SE
- 23211 3rd Ave SE
- 23031 2nd Ave SE
- 128 231st St SE
- 23219 3rd Ave SE
- 23108 3rd Ave SE
- 23308 3rd Ave SE
- 23021 2nd Ave SE
- 23307 3rd Ave SE
- 23017 2nd Ave SE
Your Personal Tour Guide
Ask me questions while you tour the home.